











Finsys is better than Tally / Busy in case of Multi Factory setup . Know How ?

20 Critical Accounting & Operational Checkpoints Every ₹100 – ₹500 Crore Company Owner Must Review

Why This Matters to You
If you’re running a ₹100 crore to ₹500 crore manufacturing or trading business with multiple plants, factories, or locations across India, you’re likely losing crores annually without even knowing it. Your current accounting software (Tally or Busy, or similar) was designed for small businesses—not for complex, multi-location enterprises like yours.
This checklist exposes 20 critical blind spots that keep you from having real-time visibility, consolidated control, and data-driven decision-making across your entire organization.
🚨 The Hard Truth
Tally and similar accounting software have fundamental limitations that become critical bottlenecks at your scale:
- ❌ Cannot create one “supplier ledger” across all plants (each location maintains separate ledgers)
- ❌ Bank reconciliation across multiple locations is manual and fragmented
- ❌ Consolidated P&L requires manual Excel work—no automatic joint view
- ❌ Consolidated Balance Sheet cannot be generated automatically across entities
- ❌ Joint GST payable across all GSTINs? Not possible without manual consolidation
- ❌ No multi-plant MRP—you’re overstocking in Plant A while Plant B faces shortages
- ❌ No inter-plant stock optimization—excess inventory sits idle while other plants purchase fresh
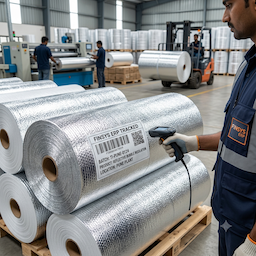
- ❌ Weak Gate Entry System … Goods may not Cross “Gate” … yet accounts may pass the Purchase entry in Tally Traditional version. ( Finsys has strong GATE entry system with QR codes)
- ❌ Weak PO Controls System … Since there is no Gate Module…. Goods Come without PO … PV Passing is not Locked
- ❌ Weak / No Quality Controls System … Goods Fail in QC … yet Purchase entry is not Locked
- ❌ No Goods in Transit System … Goods go from plant 1 to plant 2… in tally, Plant 2 does not know about any goods in transit
- Strong Gate Entry System … Goods do not Cross Gate … no Purchase entry in Finsys for “goods”.
- ❌ Strong PO Controls System … Goods Come without PO … no Purchase entry in Finsys for “goods” ~ PV Passing Locked
- ❌ Strong Quality Controls System … Goods Fail in QC … Automatic … no Purchase entry in Finsys for “goods” ~ PV Passing Locked
- ❌ Accounts does not know the Job Card position
- ❌ Production done even for black listed customer… ( in case of non payment .. ) .. here Job card level control is possible
Result: You’re making ₹500 crore decisions with fragmented, delayed, and incomplete data. & Some Forced Errors also
✅ The 20-Point Checklist: Questions Every Owner Must Ask
Section 1: Multi-Location Accounting & Consolidation (Points 1-6)
1. Single Supplier Ledger Across All Plants
Question: Can you see all purchases from “ABC Supplier Pvt Ltd” across all 5 plants in ONE ledger account?
Reality Check: In Tally, each plant maintains a separate ledger for the same supplier. You cannot:
- Negotiate better rates with consolidated purchase data
- Track total exposure to one supplier across the group
- Identify duplicate payments or discrepancies across locations
What You’re Losing: 0.5%-2% better pricing through consolidated negotiations = ₹0.50 Cr -₹ 10 crore annual savings on ₹500 crore purchases.
2. Consolidated Bank Reconciliation
Question: Can you reconcile Same bank account used across all locations in ONE Screen / One Click ?
Reality Check: Tally requires manual reconciliation per location. No automated matching across entities.
What You’re Losing:
- 15-20 hours/month of your finance team’s time
- Delayed fraud detection (average 45-60 days in manual systems)
- Unidentified duplicate payments or banking errors
3. Automatic Consolidated P&L
Question: Can you generate a joint Profit & Loss statement for ALL plants/entities instantly?
Reality Check: Tally requires manual Excel consolidation. Each plant’s P&L is separate. Inter-company transactions require manual elimination.
What You’re Losing:
- Real-time visibility into which plants are truly profitable
- Inability to make quick course corrections (by the time you see the P&L, it’s month-end)
- Board/Investor reporting delays of 5-7 days
4. Automatic Consolidated Balance Sheet
Question: Can you see your group’s total assets, liabilities, and equity in ONE Balance Sheet?
Reality Check: Manual consolidation required. Inter-company receivables/payables don’t auto-eliminate.
What You’re Losing:
- Inaccurate working capital picture
- Delayed loan covenant compliance reporting
- Inability to optimize group-level debt structure
5. Joint GST Payable Across All GSTINs
Question: Can you see total GST liability across all 8-10 GSTINs in ONE view?
Reality Check: Each GSTIN files separately. No consolidated GST dashboard. Manual Excel work to see group-level GST exposure.
What You’re Losing:
- Inability to optimize Input Tax Credit (ITC) across entities
- Missed opportunities for GST planning (₹ X Lakhs annually)
- Compliance risks from manual consolidation errors
6. Inter-Company Transaction Elimination
Question: When Plant A sells to Plant B, does your system automatically eliminate this in consolidation?
Reality Check: Manual identification and elimination required. High risk of double-counting revenue. ( Important )
What You’re Losing:
- Inflated revenue figures (misleading stakeholders)
- Incorrect tax calculations
- Audit findings and compliance issues
Section 2: Multi-Plant Inventory & MRP (Points 7-12)
7. Multi-Plant MRP (Material Requirement Planning)
Question: Does your system tell you: “Plant A has 500 units excess, Plant B needs 300 units—transfer instead of purchasing”?
Reality Check: Tally has NO MRP functionality. Each plant plans independently. No visibility into excess/shortage across locations.
What You’re Losing:
- ₹5-10 crore annually in unnecessary purchases (while excess stock sits idle elsewhere)
- 15-20% higher inventory carrying costs
- Stockouts in one plant while another has 6 months of excess
8. Multi-Plant Stock Comparison (Quantity View)
Question: Can you see the same raw material’s stock quantity across all plants in ONE screen?
Reality Check: Each plant’s stock is separate. No cross-plant visibility without manual Excel work.
What You’re Losing:
- Inability to optimize procurement (bulk buying across plants)
- Emergency purchases at premium prices (while other plants have stock)
- 10-15% higher inventory costs
9. Multi-Plant Purchase Rate Comparison
Question: Can you see what price each plant is paying for the same item from the same supplier?
Reality Check: No cross-plant purchase rate comparison. Plant A may pay ₹100/unit while Plant B pays ₹115/unit from the same supplier.
What You’re Losing:
- ₹3-5 crore annually in price arbitrage (on ₹500 crore purchases, 5-10 plants paying different rates)
- No leverage in supplier negotiations
- Rogue purchases outside approved vendor lists
10. Non-Moving Stock Identification Across Plants
Question: Can you identify slow/non-moving stock across ALL plants and redirect it before it becomes obsolete?
Reality Check: Each plant manages its own inventory. No group-level visibility into aging stock.
What You’re Losing:
- ₹2-4 crore annually in inventory write-offs (5-10% of inventory becomes obsolete)
- Missed opportunities to transfer to plants with demand
- Working capital trapped in dead stock
11. Inter-Plant Stock Transfer Optimization
Question: Does your system automatically suggest: “Transfer 200 units from Plant A to Plant C—saves ₹5 lakh in new purchases”?
Reality Check: Manual identification required. No automated transfer recommendations.
What You’re Losing:
- Unnecessary freight costs (purchasing locally while excess sits elsewhere)
- Higher working capital requirements
- 8-12% higher inventory costs
12. Real-Time Stock Visibility Across All Locations
Question: Can you see total group inventory (raw material, WIP, finished goods) in real-time?
Reality Check: Tally shows stock per location only. Consolidation requires manual Excel work (always 2-3 days old).
What You’re Losing:
- Inability to commit to large orders (don’t know total available stock)
- Over-promising to customers (stockouts damage reputation)
- Excess safety stock (₹5-8 crore trapped unnecessarily)
Section 3: Financial Control & Compliance (Points 13-16)
13. Automated Financial Consolidation for Board Reporting
Question: Can you generate board-ready consolidated financials in 1 day (not 7-10 days)?
Reality Check: Manual Excel consolidation. Inter-company eliminations done manually. Version control issues.
What You’re Losing:
- Delayed strategic decisions (by the time you see numbers, situation has changed)
- Board frustration (investors expect T+3 day reporting)
- Finance team burnout (month-end closes take 10-12 days)
14. Multi-GSTIN Data and Dashboard
Question: Can your make GST returns for all plants in 1 go… automatically… even if you have 3 plants in same state ( Example Nashik, Pune and Thane… all in Maharashtra )… or ( Gurgaon, Manesar and Sonepat, all in Haryana ) ?
Reality Check: Each “tally company” Data is taken separately.
15. Automated Cost Center-wise Profitability
Question: Can you see profitability by product line, customer, region, AND plant simultaneously?
Reality Check: Tally’s cost centers are limited. Multi-dimensional profitability analysis requires manual Excel work. .. Finsys can make BOM BASED and even time based cost sheets for each product you manufacture.
What You’re Losing:
- Inability to kill unprofitable products/customers (₹5-10 crore in hidden losses)
- Misallocation of resources to low-margin segments
- No data-driven pricing decisions
16. Cash Flow Forecasting Across All Entities
Question: Can you see consolidated cash position and 90-day cash flow forecast for the entire group?
Reality Check: Each location maintains separate cash flow. No automated consolidation. Forecasts are Excel-based and outdated.
What You’re Losing:
- Emergency borrowing at high interest (₹2-3 crore annually in extra interest)
- Missed investment opportunities (cash sitting idle in one entity while another borrows)
- Inability to negotiate better banking terms (no consolidated cash visibility)
Section 4: Operational Efficiency & Decision-Making (Points 17-20)
- Finsys has Strong Gate Entry System … Goods do not Cross Gate … no Purchase entry in Finsys for “goods”.
- Strong PO Controls System … Goods Come without PO … no Purchase entry in Finsys for “goods” ~ PV Passing Locked
- Strong Quality Controls System … Goods Fail in QC … Automatic … no Purchase entry in Finsys for “goods” ~ PV Passing Locked
- Strong Goods in Transit System …Automatic alert of pendency
17. Real-Time Dashboards for CXO-Level Decisions
Question: Can you see revenue, margins, inventory, receivables, and payables in real-time on your phone?
Reality Check: Tally is desktop-based. No mobile dashboards. Data is always 1-2 days old.
What You’re Losing:
- Reactive decision-making (not proactive)
- Inability to course-correct mid-month
- Dependency on finance team for basic reports
18. Automated Exception Reporting
Question: Does your system alert you: “Plant B’s margin dropped 5% this week” or “Customer X’s payment is 15 days overdue”?
Reality Check: No automated alerts. You discover issues in monthly reviews (too late to act).
What You’re Losing:
- Margin erosion (5% drop = ₹2.5 crore on ₹500 crore revenue)
- Bad debt accumulation (₹1-2 crore annually)
- Operational inefficiencies going unnoticed for weeks
19. Integration with Other Business Systems
Question: Is your accounting software integrated with CRM, e-commerce, manufacturing, and logistics systems?
Reality Check: Tally has limited APIs. Manual data entry from other systems. Data silos across departments. Finsys has all these things in its own relevant modules
What You’re Losing:
- 20-30 hours/week in manual data entry (₹15-20 lakh annually in labor costs)
- Data errors from manual entry (2-5% error rate = ₹1-2 crore in corrections)
- Inability to automate order-to-cash cycle
20. Scalability for Future Growth
Question: Can your current system handle: 12 plants, 8 GSTINs, 100+ users, Detailed Production and PPC and WIP ?
Reality Check: Tally struggles beyond 10-15 users. Performance degrades with large data.
What You’re Losing:
- System crashes during critical periods (month-end, year-end)
- Inability to acquire/merge new businesses (IT integration nightmare)
- Technology debt (₹50 lakh-₹1 crore to migrate later)
💰 The Real Cost of Inaction
| Area | Annual Loss | 5-Year Impact |
|---|---|---|
| Suboptimal procurement (no consolidated buying) | ₹10-15 crore | ₹50-75 crore |
| Excess inventory (no multi-plant MRP) | ₹5-10 crore | ₹25-50 crore |
| Price arbitrage (different plants, different rates) | ₹3-5 crore | ₹15-25 crore |
| Inventory write-offs (no aging visibility) | ₹2-4 crore | ₹10-20 crore |
| Margin erosion (no real-time alerts) | ₹2-3 crore | ₹10-15 crore |
| Manual labor (data entry, consolidation) | ₹50 lakh-₹1 crore | ₹2.5-5 crore |
| TOTAL | ₹22-38 crore | ₹110-190 crore |
You’re losing ₹22-38 crore EVERY YEAR by using accounting software designed for ₹10 crore businesses. ( Figures look exaggerated.. but could be really true for a large Rs 500 Crore company )
What Finsys ERP Delivers
Unified Multi-Location Architecture
- Single supplier ledger across all plants and GSTINs
- Consolidated P&L, Balance Sheet, and Cash Flow in one click
- Automatic inter-company elimination for accurate group reporting

Advanced Multi-Plant MRP
- Real-time stock visibility across all locations
- Automated transfer recommendations (excess in Plant A → shortage in Plant B)
- Purchase rate comparison across plants (identify price arbitrage)
- Non-moving stock alerts before it becomes obsolete

Intelligent Financial Control
- Multi-GSTIN compliance dashboard with automated filing
- Cost center-wise profitability (product, customer, region, plant)
- 90-day cash flow forecasting with scenario planning
- Exception-based alerts (margin drops, overdue payments, stockouts)

Real-Time Decision Support
- CXO dashboards on mobile and web
- Automated exception reporting (no more surprises)
- Integration with CRM, e-commerce, manufacturing, logistics
- Scalable architecture for 20+ plants, 100+ users, multi-currency
📊 The Finsys ROI for a ₹500 Crore Company
| Benefit | Annual Value |
|---|---|
| Consolidated procurement savings | ₹10-15 crore |
| Multi-plant inventory optimization | ₹5-10 crore |
| Purchase rate arbitrage elimination | ₹3-5 crore |
| Reduced inventory write-offs | ₹2-4 crore |
| Margin protection (real-time alerts) | ₹2-3 crore |
| Labor cost reduction (automation) | ₹50 lakh-₹1 crore |
| TOTAL ANNUAL BENEFIT | ₹22-38 crore |
Finsys pays for itself in 3-6 months and delivers ₹22-38 crore annual ROI thereafter.

Next Steps: Don’t Let Another Crore Slip Away
Immediate Actions (This Week)
- Audit your current system against these 20 checkpoints
- Quantify your losses in each area (use the framework above)
- Schedule a Finsys demo focused on your top 3 pain points
30-Day to 90 day Implementation Plan
- Week 1-2: Requirements gathering and process mapping
- Week 3-4: Finsys configuration for your multi-plant setup
- Week 5-8: Pilot rollout in 1-2 plants
- Week 9-12: Full deployment across all locations
Expected Outcomes (First 90 Days)
- ✅ Consolidated financials in real-time
- ✅ Multi-plant MRP operational
- ✅ 10-15% reduction in inventory costs
- ✅ 5-8% improvement in procurement pricing
- ✅ 50% reduction in month-end close time
📞 Contact Finsys Today
Website: www.finsys.co.in
Why Finsys?
- 35+ years of ERP expertise (since 1992)
- Deep understanding of Indian manufacturing and compliance
- Proven track record with ₹100-1000 crore companies
- End-to-end implementation support (not just software)
🔥 Final Thought
You didn’t build a ₹500 crore company by tolerating inefficiency.
So why are you running it on software designed for ₹10 crore businesses?
Every day you delay:
- ₹6-10 lakh in avoidable procurement costs
- ₹2-3 lakh in excess inventory carrying costs
- ₹1-2 lakh in margin erosion from delayed decisions
The question isn’t “Can we afford Finsys?”
The question is “Can we afford NOT to have Finsys?”
Ready to transform your multi-plant operations? Contact Finsys for a personalized ROI analysis.
Appendix: Detailed Technical Comparison
Tally vs. Finsys: Feature-by-Feature
| Feature | Tally | Finsys ERP |
|---|---|---|
| Multi-company consolidation | Manual Excel | Automatic, real-time |
| Single supplier ledger across plants | ❌ Not possible | ✅ Native support |
| Multi-plant MRP | ❌ Not available | ✅ Advanced MRP with transfer optimization |
| Consolidated P&L | Manual | One-click |
| Consolidated Balance Sheet | Manual | One-click |
| Multi-GSTIN dashboard | ❌ Separate tracking | ✅ Unified compliance |
| Inter-plant stock transfer recommendations | ❌ Manual | ✅ Automated suggestions |
| Purchase rate comparison across plants | ❌ Not possible | ✅ Real-time analytics |
| Exception-based alerts | ❌ Not available | ✅ Proactive notifications |
| Mobile dashboards | ❌ Desktop-only | ✅ Web and mobile |
| API integrations | Limited | Extensive (CRM, e-commerce, logistics) |
| Scalability | 10-15 users | 100+ users, multi-currency |
| Implementation time | N/A | 90 days for full deployment |
This document is intended for business owners, CFOs, and decision-makers at manufacturing and trading companies with ₹100+ crore revenue operating multiple plants or locations.
Prepared by: Finsys ERP Product and Implementation Team
Last reviewed: 15th August 2026