We energise the success of businesses and their communities around the world through the use of smart technology and the imagination of our people.
Read more
Find out the very latest news from across our global business and how we are helping our customers, colleagues and partners to reimagine business. Read more
is there any condition for making commercial credit note ?
Under GST law, a Commercial Credit Note (also known as a Financial Credit Note) is an internal accounting adjustment used to pass on post-sale discounts or price reductions without altering or adjusting the original GST amount.
CBIC circulars (such as Circular No. 92/11/2019-GST and Circular 251/08/2025) clarify that a supplier can issue a Commercial Credit Note without meeting the strict conditions laid down in Section 15(3)(b) or Section 34 of the CGST Act.
Key conditions, restrictions, and rules for issuing a Commercial Credit Note include:
1. Core GST Conditions & Principles
No Tax Liability Reduction for the Supplier:The supplier cannot reduce their output tax liability originally declared in GSTR-1 / GSTR-3B.
No Input Tax Credit (ITC) Reversal for the Recipient:Because the supplier is not reducing the original GST paid on the transaction, the recipient is not required to reverse their availed Input Tax Credit for the discount amount received via a commercial credit note.
No Need for a Pre-existing Agreement: Unlike GST credit notes under Section 15(3)(b)(i), a commercial credit note does not require an agreement formed at or prior to the time of supply.
No Invoice Linkage Mandate: It can be issued as a lump-sum discount without strictly mapping back to individual tax invoices.
2. Operational & Documentation Conditions
No Requirement to Declare on the GST Portal:Commercial credit notes are not reported in GSTR-1 or GSTR-3B since they do not carry GST adjustments.
Clear Document Identification: The document must be clearly styled/captioned as a “Commercial Credit Note” or “Financial Credit Note” (not a “GST Credit Note”) so tax officers do not treat it as an un-adjusted GST credit note.
Accounting Entry: It should reflect purely as financial credit in the accounting ledger (credited to the buyer’s ledger and debited to discount/sales allowance accounts).
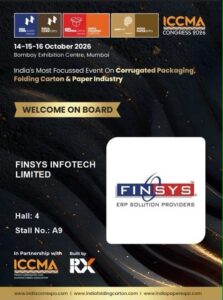
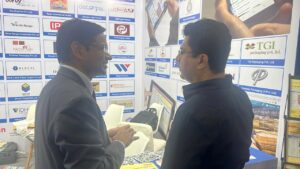
Meet Finsys ERP at Bombay Exhibition Centre, Mumbai
HALL 4 ~ Stall A9
Finsys ERP is pleased to welcome manufacturers, business owners, industry professionals, technology providers, and packaging leaders to India Corr Expo 2026.
The 2026 edition of IndiaCorr Expo will be held from 14 to 16 October 2026 at the Bombay Exhibition Centre, NESCO, Goregaon, Mumbai.
IndiaCorr Expo is one of the leading business platforms for the corrugated packaging, folding carton, paper, printing, and converting industries. It brings together corrugators, packaging manufacturers, machinery suppliers, technology providers, raw-material suppliers, and industry experts under one roof. ( For details. : visit indiacorrexpo )
Finsys has been associated with the corrugated packaging and carton manufacturing industry for many years. We look forward to meeting our existing customers, business associates, industry friends, and new organisations at this important industry event.
India Corr Expo 2026
14–16 October 2026
Bombay Exhibition Centre, Mumbai
IndiaCorr Expo 2026 will provide opportunities to:
Discover the latest corrugation and packaging machinery.
Explore new technologies for paper, carton, and packaging businesses.
Connect with suppliers, manufacturers, buyers, and industry professionals.
Understand developments in the corrugated packaging industry.
Attend business meetings and industry knowledge sessions.
Explore opportunities for growth, collaboration, and expansion.
The official event programme also includes the 12th Annual Congress of ICCMA, bringing together leading voices and professionals from the corrugated packaging industry.
Meet Finsys ERP
Running a corrugated box or packaging manufacturing business involves managing multiple activities simultaneously:
Estimation and quotation.
Customer orders and production planning.
Paper, kraft, reel, sheet, and consumable inventory.
Machine scheduling and job work.
Wastage and production monitoring.
Quality control.
Dispatch and delivery.
Receivables and customer outstanding.
Costing, profitability, and management reporting.
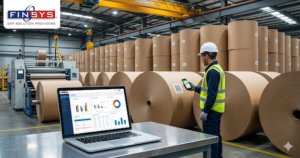
Finsys ERP brings these activities together in one integrated business management system.
Our ERP solution helps corrugated box manufacturers, paper converters, packaging companies, and carton manufacturers improve visibility, control, and coordination across their business operations.
Why Corrugated Packaging Businesses Choose Finsys
Integrated business management
Manage marketing, sales, purchase, inventory, production, finance, dispatch, and reporting through an integrated ERP platform.
Better production planning
Plan jobs, machines, materials, and delivery schedules more effectively with improved coordination between departments.
Real-time inventory visibility
Track kraft paper, reels, sheets, boards, consumables, finished goods, and other inventory items with greater accuracy.
Accurate costing and profitability
Understand the cost and profitability of each customer order, product, job, or production activity.
Control over wastage
Monitor material consumption, production output, wastage, rejects, and process losses to improve operational efficiency.
Faster decision-making
Access useful management reports, dashboards, alerts, extracts, and business information without waiting for manual consolidation.
Connect sales, production, stores, purchase, finance, dispatch, and management through a common system.
Finsys ERP for Corrugated Box Manufacturers
Finsys ERP is designed to support the practical requirements of corrugated packaging and box manufacturing businesses.
The system can help businesses manage:
Customer quotations and estimates.
Order booking and order status.
Paper and board requirements.
Reel and sheet inventory.
Corrugation and conversion processes.
Multi-stage production.
Job cards and production planning.
Material issue and consumption.
Wastage and rejection analysis.
Finished-goods stock.
Dispatch planning.
Transport and delivery details.
Customer-wise sales and profitability.
Receivables and payment follow-up.
Financial accounting and statutory reporting.
The objective is simple: provide business owners and management with reliable information for better control and better decisions.
Finsys ERP is one of the best selling ERP Softwares for Corrugated Box(Packaging)
Finsys ERP for the Packaging Industry
Finsys ERP can be configured for different types of packaging and paper-related businesses, including:
Corrugated box manufacturers.
Corrugation plants.
Paper and kraft-paper converters.
Duplex-board and carton manufacturers.
Folding-carton businesses.
Printed packaging manufacturers.
Packaging material suppliers.
Job-work and conversion units.
Manufacturers operating multiple machines or locations.
Every business has its own processes, costing methods, product structures, and reporting requirements. Finsys ERP can be adapted to the operational needs of the organisation.
A Practical ERP for Business Growth
Technology should not make business operations more complicated. It should make information easier to access, processes easier to control, and decisions easier to take.
Finsys ERP is developed with a practical understanding of manufacturing, packaging, accounting, inventory, production, costing, customer management, and business reporting.
Our team works with management and operational teams to understand existing processes and implement an ERP system that supports actual business requirements.
Meet Our Team at India Corr Expo 2026
Are you planning to improve your business systems?
Are you looking for better control over production, inventory, costing, receivables, and profitability?
Are you considering ERP software for your corrugated box or packaging business?
We would be pleased to meet you during India Corr Expo 2026.
During the meeting, we can discuss:
Your current business processes.
Existing software and operational challenges.
Production and inventory requirements.
Costing and profitability concerns.
Reporting and management information needs.
ERP implementation possibilities.
Integration and customisation requirements.
Future business expansion plans.
Let Us Discuss Your Business
A short discussion can help identify where ERP software may improve your business operations.
Whether you are:
Using spreadsheets and manual registers.
Working with separate software systems.
Facing stock and production mismatches.
Finding it difficult to calculate accurate job costing.
Experiencing delays in management reporting.
Planning to expand your manufacturing operations.
Looking for a more integrated ERP solution.
Finsys can help you evaluate your requirements and identify a suitable way forward.
Book a Meeting with Finsys
To schedule a meeting with our team at India Corr Expo 2026, please contact us in advance.
You can discuss your preferred date and time, business requirements, and the areas you would like to see during the demonstration.
Request a Meeting or ERP Demonstration
send a email to corporate(at) Finsys.in or Whatsapp / Phone call at +919312608426 with following details
Name: Company: Mobile number: Email: City: Business type: Requirements or message:
Event Details
Particular
Details
Event
India Corr Expo 2026
Dates
14–16 October 2026
Venue
Bombay Exhibition Centre
Location
NESCO, Goregaon, Mumbai, Maharashtra 400063
Industry
Corrugated packaging, paper, carton, printing, and converting
Associated event
12th Annual Congress of ICCMA
Visit India Corr Expo 2026
IndiaCorr Expo 2026 is an opportunity to see the latest developments in corrugated packaging, connect with industry professionals, explore new technologies, and identify solutions for business growth.
Finsys ERP looks forward to welcoming you at the exhibition.
Meet Finsys. Discuss your business. Explore better control with ERP.
India Corr Expo 2026 will be held from 14 to 16 October 2026.
Where will India Corr Expo 2026 be held?
The exhibition will be held at the Bombay Exhibition Centre, NESCO, Goregaon, Mumbai, Maharashtra.
What is India Corr Expo?
IndiaCorr Expo is a business exhibition and networking platform for the corrugated packaging, folding carton, paper, printing, and converting industries.
What does Finsys ERP offer to corrugated box manufacturers?
Finsys ERP helps manage sales, estimation, production, inventory, costing, wastage, dispatch, receivables, accounting, and management reporting through an integrated ERP system.
Can I request a Finsys ERP demonstration?
Yes. Visitors can request a meeting or ERP demonstration by submitting the enquiry form on this page.
Can Finsys ERP be configured for our specific business?
Finsys ERP can be evaluated and configured according to the organisation’s processes, products, manufacturing activities, reporting requirements, and operational needs.
Does Finsys ERP support packaging and carton businesses?
Yes. Finsys ERP is suitable for businesses involved in corrugated boxes, packaging, paper conversion, cartons, printing, and related manufacturing activities.
Advance Tax Due Date Reminder: Secure Your 2nd Installment by September 15
The second quarter of the financial year is closing, which means the September 15 deadline for your second Advance Tax installment is rapidly approaching. Failing to estimate your income correctly or missing this deadline can lead to compounding penal interest.
Here is a comprehensive guide to understanding, calculating, and paying your second advance tax installment.
Who is Legally Required to Pay Advance Tax?
The “Pay As You Earn” scheme applies to almost everyone generating substantial income outside of a standard salary where TDS is fully deducted. You must pay advance tax if your total estimated tax liability for the financial year (after deducting TDS/TCS) is ₹10,000 or more.
Salaried Individuals: If you earn significant additional income (e.g., rental income, capital gains from stocks/mutual funds, high-interest income, or dividends).
Business Owners & Corporates: All companies, partnership firms, and LLPs.
Freelancers & Professionals: Consultants, doctors, lawyers, and gig workers.
Exemption: Resident senior citizens (aged 60 or above) who do not have any income from a business or profession are entirely exempt from paying advance tax.
Presumptive Taxation (Section 44AD/44ADA): Taxpayers under this scheme do not pay quarterly; their single deadline for 100% advance tax is March 15.
The Income Tax Department is strict about timely collections. Shortfalls trigger mandatory interest:
Section 234C (Shortfall in Installments): If your September payment falls short of the 45% target, you will be charged 1% interest per month for 3 months on the shortfall amount. (Note: A slight leniency is given if you pay at least 36% by Sept 15, avoiding 234C for this specific quarter).
Section 234B (Default in Payment): If your total advance tax paid by the end of the financial year is less than 90% of the assessed tax, you will face an additional 1% interest per month starting from April 1 of the following year until the tax is fully paid.
Step-by-Step Online Payment Guide
Visit the official e-Filing portal (incometax.gov.in).
Navigate to e-Pay Tax (you can do this pre-login or post-login).
Enter your PAN/TAN and verify via OTP.
Select the Income Tax box and choose the correct Assessment Year (e.g., AY 2027-28 for FY 2026-27).
Select Payment Type as Advance Tax (100).
Enter the tax amount and pay via Net Banking, Debit Card, NEFT/RTGS, or UPI.
Crucial: Download and save the Challan Receipt (CRN/BSR code) to report in your final ITR.
Website :- https://finsys.co.in/
For many business owners, September is not just another month. It is the time to review the financial position of the business, estimate tax liability, prepare for statutory compliances, and take corrective action before the year-end rush begins.
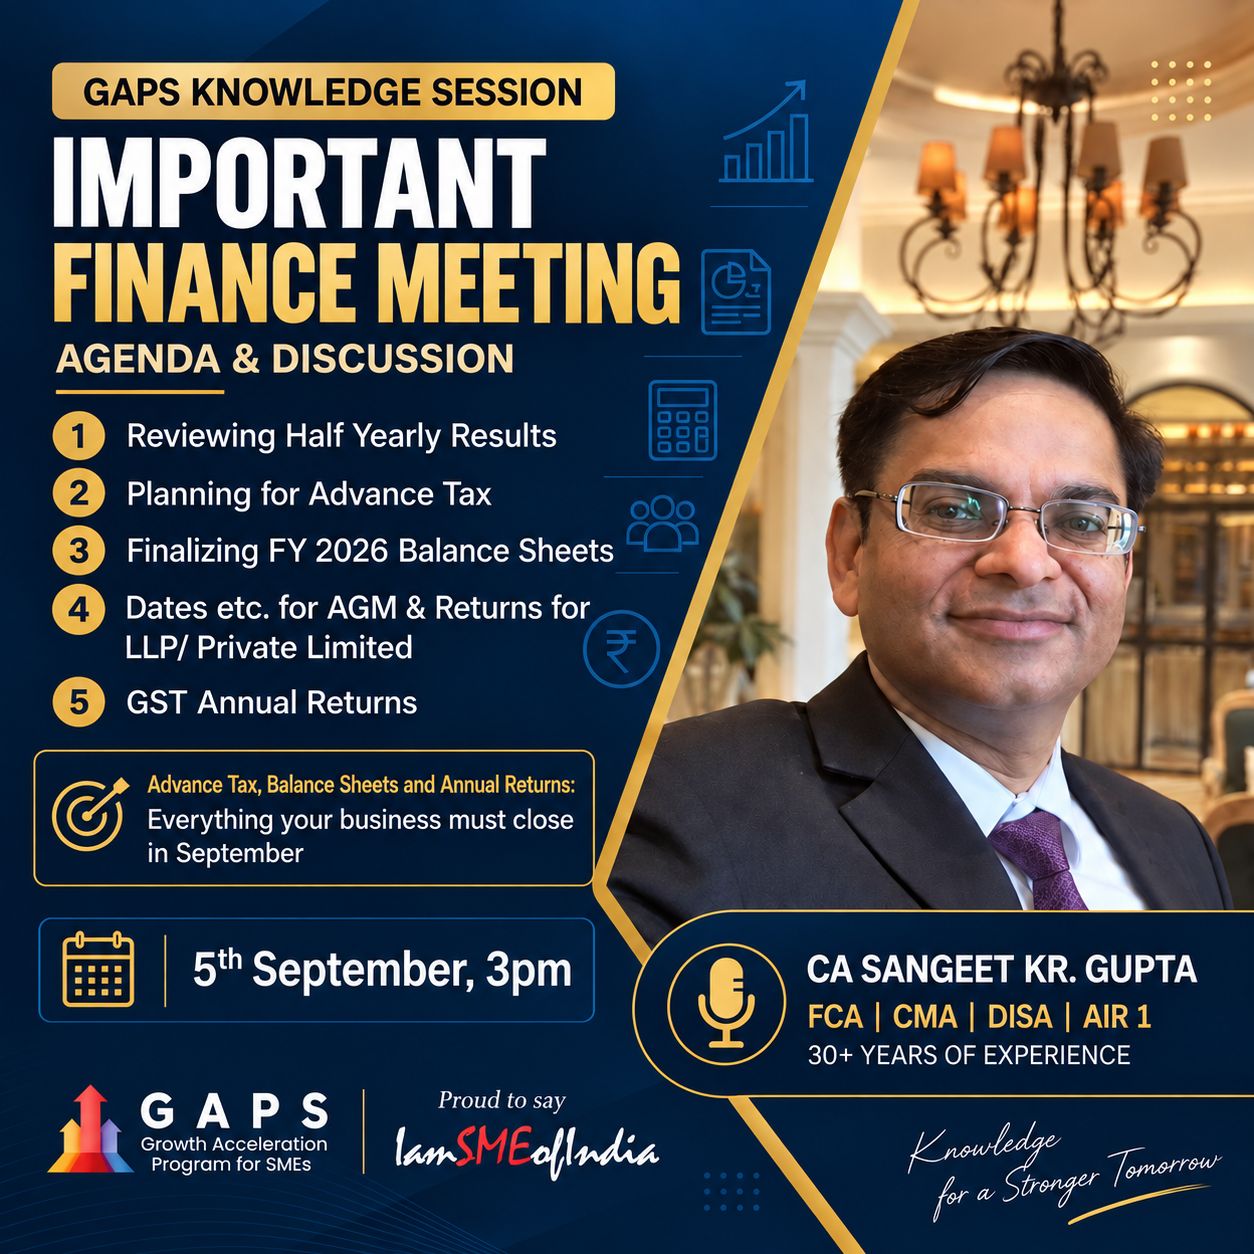
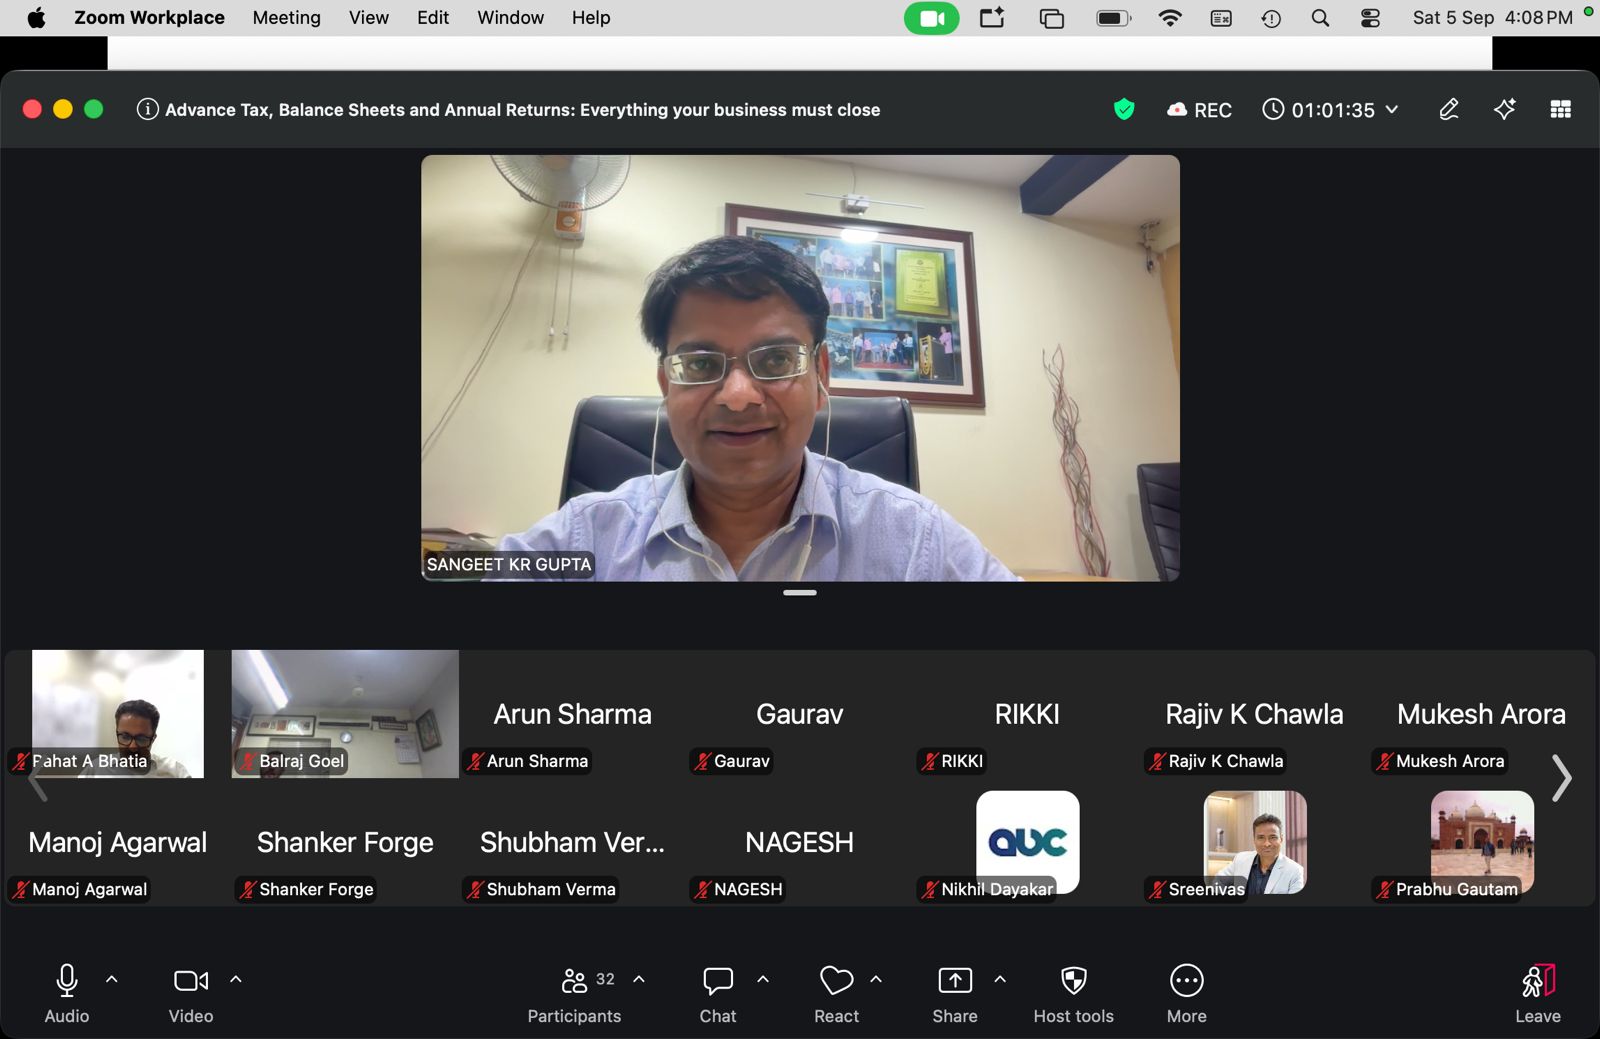
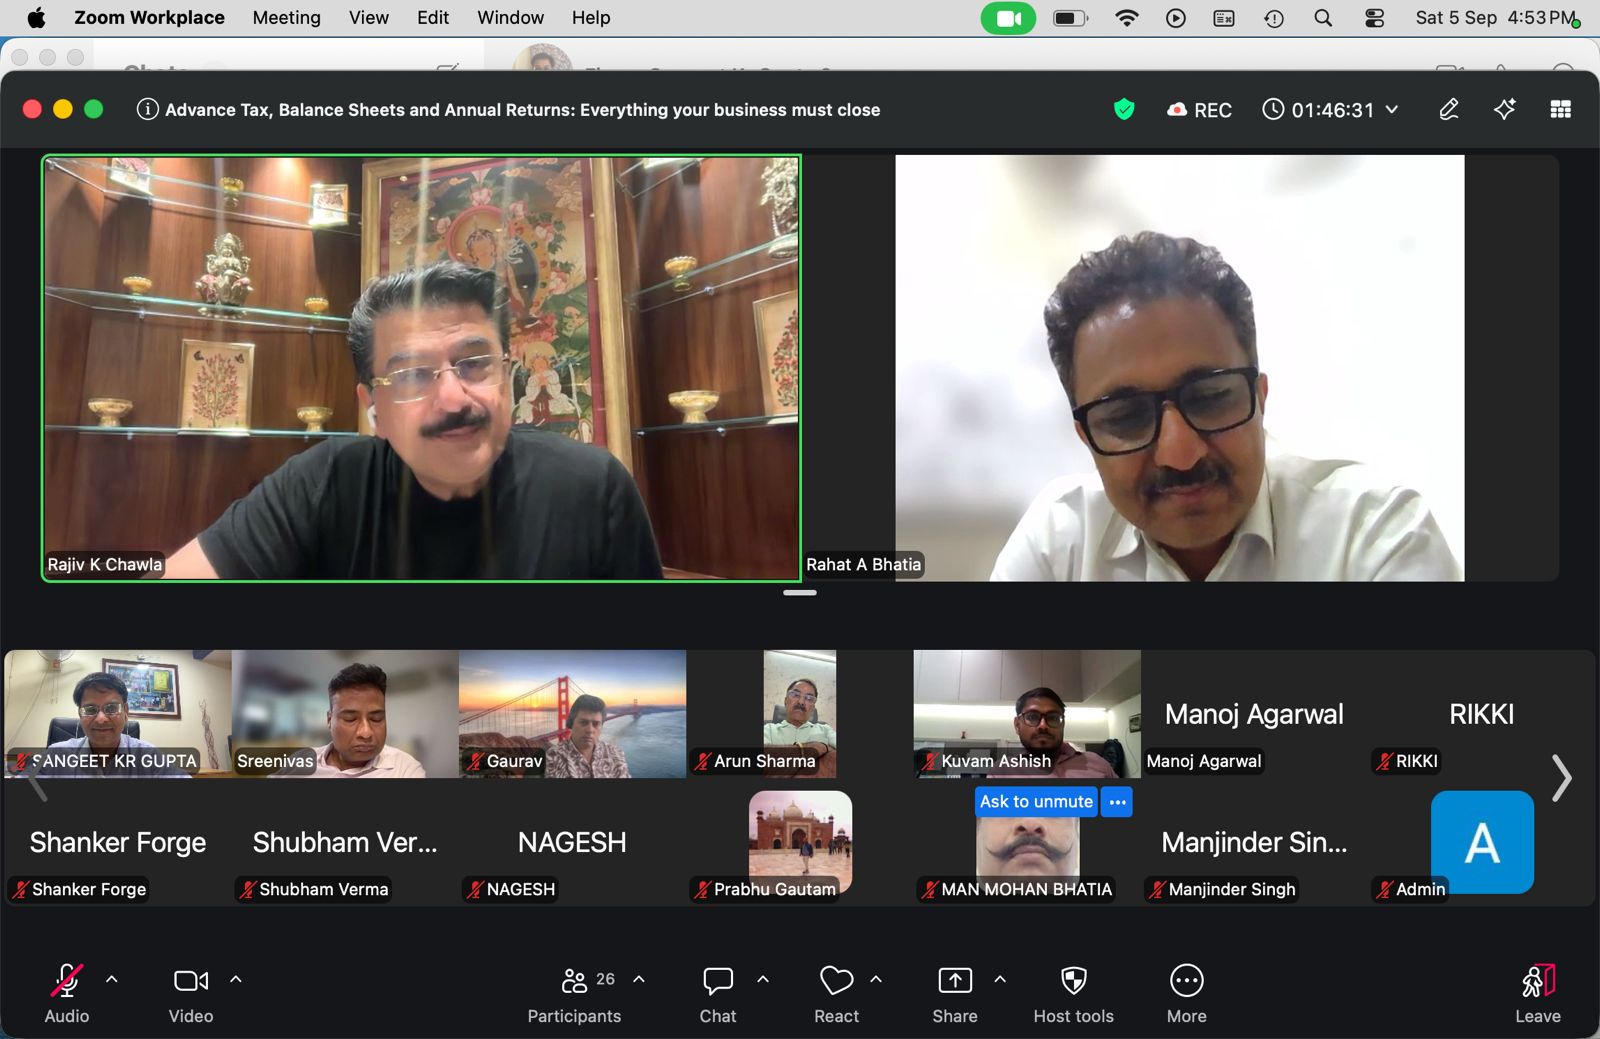
The GAPS Knowledge Session: Finance Meeting, organised in collaboration with the Integrated Association of Micro, Small and Medium Enterprises of India, is designed as a practical working session for entrepreneurs, directors, partners and professionals.
This is not a routine lecture on accounting theory. It is an opportunity to review your own numbers, identify risks and understand what needs to be discussed with your CA, accountant or finance team.
What will be covered?
1. Advance tax planning
The September advance-tax instalment is an important checkpoint for every profitable business and individual with taxable income.
Participants will understand:
Who is required to pay advance tax.
How to estimate the full-year tax liability from half-yearly results.
How to adjust TDS and TCS already deducted or expected during the year.
How to calculate the September instalment.
How business profit, capital gains, interest income and other sources affect tax liability.
How underpayment can result in interest costs.
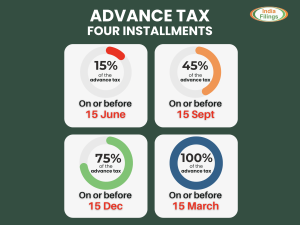
The normal instalment schedule requires cumulative payment of approximately 15% by 15 June, 45% by 15 September, 75% by 15 December and 100% by 15 March, subject to the applicable provisions and taxpayer category.
Participants will be shown practical methods to estimate advance tax for different situations, including a small MSME, an individual earning capital gains and a medium-sized company.
The objective is simple: do not wait until the return-filing season to discover that a large tax payment is payable.
2. Reviewing half-yearly numbers
A business owner should not look only at sales and bank balance. The real financial health of the business is visible through profitability, working capital, debt and cash-flow indicators.
The session will explain how to review:
Gross profit and net profit margins.
Current ratio and liquidity.
Debt-equity ratio.
Debtor turnover and receivable ageing.
Creditor turnover and payment patterns.
Debt-service coverage ratio.
Inventory movement.
Cash generated from business operations.
For example, if the net profit ratio was consistently 5% for the last five years but has fallen to 1% this year, the owner should investigate the reason. It may be due to reduced selling prices, higher raw-material costs, increased salaries, finance costs, abnormal expenses or incorrect accounting.
Similarly, if the debt-equity ratio has increased from 2:1 to 4:1 after new borrowings, the business should examine whether the loans were used for productive assets, working capital, personal withdrawals or to cover operating losses.
Ratios are not merely figures prepared for a bank or annual report. They are early-warning signals for the business owner.
3. AGM and annual ROC compliance
Companies must plan their Annual General Meeting well in advance. For most companies, the AGM for FY 2025–26 is required to be held by 30 September 2026, subject to applicable provisions and exceptions.
The session will cover practical questions such as:
Who is required to conduct an AGM?
Who prepares the AGM notice?
What is the appropriate notice period?
Can notice be sent by email, post or both?
When is shorter notice permitted?
Who should attend the AGM?
How should attendance be recorded?
What minutes and resolutions need to be maintained?
How should multiple companies sharing the same CA or professional team schedule their AGMs?
All companies cannot realistically hold their meetings at the same time on 30 September. Directors and professionals should therefore prepare a clear calendar, finalise the financial statements and schedule meetings in a practical sequence.
After the AGM, companies must also plan their ROC filings:
AOC-4: generally within 30 days of the AGM.
MGT-7 or MGT-7A: generally within 60 days of the AGM.
The session will help business owners understand that conducting the AGM is only one part of the process. Proper notices, attendance records, minutes, resolutions and post-AGM filings are equally important.
4. Registered-office compliance and MGT-7
MCA compliance is becoming increasingly data-driven and verification-oriented. Businesses should ensure that their registered-office details are accurate and consistent across MCA records, GST registration, bank records, invoices and other official documents.
The revised annual-return process has increased attention on registered-office information, including the need to keep a clear photograph of the premises and relevant location details ready where required by the form and portal.
The registered office should have:
A valid and complete address.
A visible company name board.
Proper records and documents.
Consistency with the address reported to MCA.
Evidence that the office is operational and accessible.
A company should not treat the registered office as merely a postal address. Incorrect, dormant or unverifiable premises can create serious compliance concerns.
5. LLP compliance and business structure
The session will also discuss important LLP compliances, including:
Form 8: Statement of Account and Solvency, generally due by 30 October.
Form 11: Annual Return, generally due by 30 May.
The difference between company and LLP compliance.
Situations in which an LLP may be suitable.
Situations in which a private limited company may be more appropriate.
Practical considerations relating to ownership, funding, liability, compliance cost and succession.
Choosing between a proprietorship, partnership, LLP and private limited company should not be based only on registration cost. The decision should consider taxation, liability protection, investment plans, governance, continuity and the future growth of the business.
6. GST annual return and e-way bill reconciliation
GSTR-9 preparation should not be postponed until the last month. The process becomes easier when the business starts reconciling its books and GST returns immediately after finalising the accounts.
Important reconciliations include:
Turnover as per books versus GSTR-1.
Turnover as per books versus GSTR-3B.
Input tax credit as per books versus GSTR-2B.
Credit notes and debit notes.
Reverse-charge transactions.
Exempt, nil-rated and non-GST supplies.
HSN-wise reporting.
State-wise turnover and tax liability.
The session will also highlight e-way bill controls. Businesses involved in movement of goods should ensure that no consignment moves without the required documentation. E-way bills should be reviewed regularly, ideally daily for high-volume businesses or at least monthly for smaller businesses.
A periodic reconciliation can identify cancelled, expired, duplicated or unused e-way bills and help prevent future queries.
7. Balance-sheet review before approval
Before signing off the financial statements, business owners should discuss key items with their finance team and CA:
Accrued professional, audit and legal fees.
Bonus, incentives, gratuity and leave encashment.
Depreciation and fixed-asset additions or disposals.
Physical verification of inventory and fixed assets.
Old computers, laptops and electronic waste.
Director remuneration and related-party transactions.
Director loans and debit balances.
Pending litigation and tax notices.
Bank reconciliation.
GST and TDS reconciliations.
Current-tax provision and applicable tax adjustments.
Unpaid director remuneration, personal expenses paid by the company, large withdrawals and non-moving loan balances should be reviewed and regularised wherever necessary.
8. ROC Amnesty and compliance clean-up
The Companies Compliance Facilitation Scheme, 2026, popularly referred to as the ROC Amnesty Scheme, provides an opportunity to regularise eligible delayed ROC filings at substantially reduced additional fees.
The latest reported deadline is 15 September 2026.
Eligible delayed filings may include forms such as AOC-4, MGT-7/MGT-7A, ADT-1, DIR-12, INC-22 and other applicable statutory forms, subject to the scheme conditions. The scheme has been described as providing a substantial waiver of additional fees for eligible filings.
Companies with old filing defaults should immediately:
Download the master data and filing history.
Identify all pending forms.
Check whether financial statements and annual returns are missing.
Verify director and registered-office details.
Prepare the forms and attachments.
File before the scheme deadline.
This may be a valuable last opportunity for companies to complete their compliance records before normal additional fees and enforcement measures resume.
Attend with your numbers
Participants are encouraged to keep the following information available during the session:
Sales and expenses for the first half of the year.
Estimated full-year profit.
TDS and TCS details.
Advance-tax payments.
Debtor and creditor ageing.
Loan balances and repayment schedules.
GST turnover and input-credit figures.
Pending ROC filings.
Registered-office details.
Details of related-party transactions.
The purpose of the meeting is to help you ask better questions, understand your own financial position and take timely action.
Good financial management is not simply about filing returns. It is about knowing where your business stands before making the next important decision.
Airport Flight Dashboard in Your Factory: Live Dispatch Tracking with Finsys ERP
When you walk inside a busy international airport, large flight information display screens constantly update departure times, gate changes, boarding statuses, and delays. As a result, passengers and airline staff always know what needs to be done without asking anyone. Inspired by this visual management model, CA Sangeet Gupta explains how implementing a dispatch dashboard in Finsys ERP brings the same clarity to manufacturing shop floors.
Today, tier-1 manufacturing clients such as Maruti, Samsung, and LG operate on strict hourly delivery schedules and tight window dispatch requirements. Consequently, even a slight delay in shipment arrival can cause assembly line stoppages and heavy financial penalties. Therefore, mounting real-time, airport-style visual dashboards on factory TV screens transforms store management, finished goods tracking, and on-time dispatches.
Why Modern Factories Need Real-Time Visual Dashboards
Traditionally, factory store managers track daily dispatches using physical whiteboards and manual marker pens. However, manual updating leads to delayed data, communication gaps, and missed customer delivery windows. Instead, digital dashboards offer several immediate advantages:
Clear Shipment Timelines: The screen displays the planned departure time versus actual truck loading progress for every customer order.
Visual Countdown Alerts: Floor teams can see the exact minutes remaining before a shipment window closes, creating proactive operational urgency.
Traffic Light Color Coding: Orders switch from green (on time) to yellow (urgent) and red (critical delay) so staff can prevent escalations before they happen.
Zero Whiteboard Dependency: Data populates automatically from ERP sales orders, packing slips, and gate passes in real time.
How the Dispatch Dashboard in Finsys ERP Operates
Finsys ERP connects shop-floor execution with large-screen television monitors installed in finished goods (FG) stores, security gates, and dispatch docks. Here is how the system functions:
1. Automated Shipment Queue & Order Priority
First, all pending customer dispatch orders for the day are automatically queued by target dispatch time, vehicle slot, and customer priority. Furthermore, the dashboard groups orders by carrier, delivery location, and product SKU.
2. Real-Time Truck Loading & Packing Status
Next, as warehouse staff scan barcodes and load cartons into trucks, Finsys updates the order status dynamically. Thus, supervisors can instantly see whether an order is in picking, staged on the dock, or actively loading.
3. Instant Audit & Customer Inspection Impression
In addition, when original equipment manufacturers (OEMs) or audit teams visit your plant, live digital screens display world-class operational control. Showing customers a fully automated dispatch screen proves that your factory runs on transparent, smart systems rather than manual guesswork.
Key Business Outcomes for Manufacturing Plants
Deploying live visual dashboards across finished goods stores and dispatch docks delivers tangible operational benefits:
Zero Line Stoppage Penalties: Meet strict OEM delivery slots and eliminate costly late-delivery penalties.
Enhanced Shop-Floor Clarity: Keep workers and truck drivers aligned on loading priorities without verbal follow-ups.
Faster Vehicle Turnaround Time: Speed up dock loading cycles and reduce vehicle detention costs.
Unified Real-Time Visibility: Give management instant visibility across all active factory dispatches.
Implement Smart Visual Dashboards with Finsys ERP
Ultimately, modern manufacturing demands visual management tools that keep every employee accountable and proactive. Upgrade your factory floor from manual whiteboards to smart, real-time dispatch screens.