We energise the success of businesses and their communities around the world through the use of smart technology and the imagination of our people.
Read more
Find out the very latest news from across our global business and how we are helping our customers, colleagues and partners to reimagine business. Read more
Airport Flight Dashboard in Your Factory: Live Dispatch Tracking with Finsys ERP
When you walk inside a busy international airport, large flight information display screens constantly update departure times, gate changes, boarding statuses, and delays. As a result, passengers and airline staff always know what needs to be done without asking anyone. Inspired by this visual management model, CA Sangeet Gupta explains how implementing a dispatch dashboard in Finsys ERP brings the same clarity to manufacturing shop floors.
Today, tier-1 manufacturing clients such as Maruti, Samsung, and LG operate on strict hourly delivery schedules and tight window dispatch requirements. Consequently, even a slight delay in shipment arrival can cause assembly line stoppages and heavy financial penalties. Therefore, mounting real-time, airport-style visual dashboards on factory TV screens transforms store management, finished goods tracking, and on-time dispatches.
Why Modern Factories Need Real-Time Visual Dashboards
Traditionally, factory store managers track daily dispatches using physical whiteboards and manual marker pens. However, manual updating leads to delayed data, communication gaps, and missed customer delivery windows. Instead, digital dashboards offer several immediate advantages:
Clear Shipment Timelines: The screen displays the planned departure time versus actual truck loading progress for every customer order.
Visual Countdown Alerts: Floor teams can see the exact minutes remaining before a shipment window closes, creating proactive operational urgency.
Traffic Light Color Coding: Orders switch from green (on time) to yellow (urgent) and red (critical delay) so staff can prevent escalations before they happen.
Zero Whiteboard Dependency: Data populates automatically from ERP sales orders, packing slips, and gate passes in real time.
How the Dispatch Dashboard in Finsys ERP Operates
Finsys ERP connects shop-floor execution with large-screen television monitors installed in finished goods (FG) stores, security gates, and dispatch docks. Here is how the system functions:
1. Automated Shipment Queue & Order Priority
First, all pending customer dispatch orders for the day are automatically queued by target dispatch time, vehicle slot, and customer priority. Furthermore, the dashboard groups orders by carrier, delivery location, and product SKU.
2. Real-Time Truck Loading & Packing Status
Next, as warehouse staff scan barcodes and load cartons into trucks, Finsys updates the order status dynamically. Thus, supervisors can instantly see whether an order is in picking, staged on the dock, or actively loading.
3. Instant Audit & Customer Inspection Impression
In addition, when original equipment manufacturers (OEMs) or audit teams visit your plant, live digital screens display world-class operational control. Showing customers a fully automated dispatch screen proves that your factory runs on transparent, smart systems rather than manual guesswork.
Key Business Outcomes for Manufacturing Plants
Deploying live visual dashboards across finished goods stores and dispatch docks delivers tangible operational benefits:
Zero Line Stoppage Penalties: Meet strict OEM delivery slots and eliminate costly late-delivery penalties.
Enhanced Shop-Floor Clarity: Keep workers and truck drivers aligned on loading priorities without verbal follow-ups.
Faster Vehicle Turnaround Time: Speed up dock loading cycles and reduce vehicle detention costs.
Unified Real-Time Visibility: Give management instant visibility across all active factory dispatches.
Implement Smart Visual Dashboards with Finsys ERP
Ultimately, modern manufacturing demands visual management tools that keep every employee accountable and proactive. Upgrade your factory floor from manual whiteboards to smart, real-time dispatch screens.
How Finsys ERP Automates Physical Stock Verification in Manufacturing Plants
In manufacturing plants, manual inventory counting on paper sheets often leads to delayed reconciliations, counting errors, and disrupted production schedules. Therefore, Finsys ERP replaces obsolete clipboards with a structured, barcode-driven physical stock audit module. As a result, companies can easily match live shop-floor reality with financial ledgers in real time.
Moreover, this approach is inspired by disciplined zoning and visual counting systems—a practical concept highlighted by CA Sangeet Gupta. Consequently, the physical stock verification in Finsys ERP gives plant heads, store managers, and statutory auditors complete transparency across raw materials, WIP, and finished goods.
The Finsys ERP Physical Stock Audit Workflow
To ensure flawless execution, Finsys standardizes the physical counting lifecycle into five controlled, system-driven steps:
1. Digital Stock Freeze & Cut-Off Management
Before counting starts, Finsys ERP allows administrators to lock specific stores, racks, or item groups without freezing the entire plant. In addition, any incoming material during the audit is diverted directly to a virtual Quarantine Inspection Store in the system. Thus, uncounted purchases do not distort the live audit figures.
2. Mobile Barcode & QR Code Floor Scanning
Next, audit teams scan physical bins, rolls, pallets, and finished item tags using handheld terminals (HHT) or the Finsys Mobile Scanner app. During this step, the system automatically captures:
Exact Item Code, Lot/Heat Number, and Roll ID
Primary and Secondary Quantities (e.g., Weight in Kg vs. Length in Meters)
Bin/Rack Location Coordinates
Timestamp and Auditor User ID
3. Blind Stock Counting Protocol
Furthermore, to ensure 100% integrity, Finsys supports a dedicated “Blind Count” interface. Because floor auditors cannot see the system’s recorded book balances, they must perform an authentic physical scan. As a result, floor staff cannot simply copy pre-existing numbers.
4. Instant Automated Variance Analysis
As soon as counting concludes, Finsys automatically cross-references physical scans against ERP book records. Consequently, it generates a real-time variance matrix displaying:
Shortages / Excesses: Exact quantity and valuation gaps per item.
Location Discrepancies: Stock found in unassigned racks or wrong production bays.
WIP Discrepancies: Semi-finished batches stalled across machine operations.
5. Controlled Stock Adjustment Vouchers
Finally, once discrepancies are investigated and approved by authorized plant heads, Finsys posts automated Stock Adjustment (Debit/Credit) vouchers. Therefore, the general ledger and inventory valuations update instantaneously, while preserving complete audit logs for statutory compliance.
Key Features Built into Finsys Stock Audit Module
Besides streamlining counts, Finsys provides several advanced capabilities for modern factories:
Perpetual Cycle Counting: Audit high-value (ABC Category A) materials weekly without shutting down factory operations.
Dual-Unit Conversion Validation: Avoid unit mismatch errors during physical counts (e.g., Sheets vs. Kg, Rolls vs. Sq. Meters).
Multi-Location Sync: Simultaneously run audits across multiple factory units and regional distribution warehouses from a central dashboard.
Batch & Expiry Validation: Identify aging lots, slow-moving items, and unrecorded shop-floor scrap during the scan.
Achieve 100% Inventory Precision with Finsys ERP
Ultimately, automating physical verification eliminates inventory write-offs, prevents audit penalties, and maintains exact shop-floor clarity across all manufacturing plants.
Do you know that Accounts Dept becomes Stronger with Finsys ( as compared to parallel Tally )
Let us see “How….?”
Critical Accounting & Operational Checkpoints … mandatory for a ₹1000 Company
Why This Matters to You
If you’re running a ₹1000 crore manufacturing business with multiple plants, factories, or locations across India,
You have a big responsibility
Towards Customers, Towards Suppliers, Towards Staff… towards a hundred things…
This is one thing you want to be safe on
Accounts | Payments | Receipts
No control of PO.. ….
Vendor bill can be passed manually without PO / at lower rate or higher rate… a lot of extra work by the CA heads… to ensure that this does not happen
a big risk for the Outsourced CA firm
and for the company
in case of PO linked .. it is as strong as SAP HANA…. Finsys becomes Strongest possible.
No control of “Quality Pass” or not.. ….
Vendor bill can be passed manually without Checking confirming that QC was ok or not ?
a lot of extra work by the CA heads… to ensure that this does not happen
a big extra effort for the Outsourced CA firm, and for the company
in case of Finsys, the QC is mandatory in the ERP… No QC. means no bill passing…
Even template wise, reason wise QC can be mandatory.. and can be seen durlng Voucher entry
in case of PO linked .. it is as stronger than SAP HANA…. Finsys becomes Strongest possible.
No control of “Proper Gate Entry”.. ….
Vendor bill can be passed manually without Checking confirming that Goods reached the Gate or not….. only visual check of the manual stamp on the invoice
Was the process followed or not ?
a lot of extra work by the CA heads… to ensure that this does not happen
a big risk for the Outsourced CA firm, and for the company
in case of Finsys, the Gate Entry is mandatory in the ERP… No GE. means no bill passing…
.. it is as stronger than SAP HANA…. Finsys becomes Strongest possible. … SAP B1 does not have this in some variants, we are told
Transporter bill passing
Same vendor , same bill , in different branches ?
🚨 The other Risks
Tally and similar accounting software have fundamental limitations that become critical bottlenecks at your scale:
❌ Cannot create one “supplier ledger” across all plants (each location maintains separate ledgers)
❌ Bank reconciliation across multiple locations is manual and fragmented
❌ Consolidated Balance Sheet cannot be generated automatically across entities
❌ Joint GST payable across all GSTINs? Not possible without manual consolidation
❌ No multi-plant MRP—you’re overstocking in Plant A while Plant B faces shortages
❌ No inter-plant stock optimization—excess inventory sits idle while other plants purchase fresh
❌ Weak Gate Entry System … Goods may not Cross “Gate” … yet accounts may pass the Purchase entry in Tally Traditional version. ( Finsys has strong GATE entry system with QR codes)
❌ Weak PO Controls System … Since there is no Gate Module…. Goods Come without PO … PV Passing is not Locked
❌ Weak / No Quality Controls System … Goods Fail in QC … yet Purchase entry is not Locked
❌ No Goods in Transit System … Goods go from plant 1 to plant 2… in tally, Plant 2 does not know about any goods in transit
Strong Gate Entry System … Goods do not Cross Gate … no Purchase entry in Finsys for “goods”.
❌ Strong PO Controls System … Goods Come without PO … no Purchase entry in Finsys for “goods” ~ PV Passing Locked
❌ Strong Quality Controls System … Goods Fail in QC … Automatic … no Purchase entry in Finsys for “goods” ~ PV Passing Locked
❌ Accounts does not know the Job Card position
❌ Production done even for black listed customer… ( in case of non payment .. ) .. here Job card level control is possible
Result: You’re making ₹500 crore decisions with fragmented, delayed, and incomplete data. & Some Forced Errors also
✅ The 20-Point Checklist: Questions Every Owner Must Ask
Section 3: Financial Control & Compliance (Points 13-16)
13. Automated Financial Consolidation for Board Reporting
Question: Can you generate board-ready consolidated financials in 1 day (not 7-10 days)?
Reality Check: Manual Excel consolidation. Inter-company eliminations done manually. Version control issues.
What You’re Losing:
Delayed strategic decisions (by the time you see numbers, situation has changed)
Board frustration (investors expect T+3 day reporting)
Finance team burnout (month-end closes take 10-12 days)
14. Multi-GSTIN Data and Dashboard
Question: Can your make GST returns for all plants in 1 go… automatically… even if you have 3 plants in same state ( Example Nashik, Pune and Thane… all in Maharashtra )… or ( Gurgaon, Manesar and Sonepat, all in Haryana ) ?
Reality Check: Each “tally company” Data is taken separately.
15. Automated Cost Center-wise Profitability
Question: Can you see profitability by product line, customer, region, AND plant simultaneously?
Reality Check: Tally’s cost centers are limited. Multi-dimensional profitability analysis requires manual Excel work. .. Finsys can make BOM BASED and even time based cost sheets for each product you manufacture.
What You’re Losing:
Inability to kill unprofitable products/customers (₹5-10 crore in hidden losses)
Misallocation of resources to low-margin segments
No data-driven pricing decisions
16. Cash Flow Forecasting Across All Entities
Question: Can you see consolidated cash position and 90-day cash flow forecast for the entire group?
Reality Check: Each location maintains separate cash flow. No automated consolidation. Forecasts are Excel-based and outdated.
What You’re Losing:
Emergency borrowing at high interest (₹2-3 crore annually in extra interest)
Missed investment opportunities (cash sitting idle in one entity while another borrows)
Inability to negotiate better banking terms (no consolidated cash visibility)
Finsys has Strong Gate Entry System … Goods do not Cross Gate … no Purchase entry in Finsys for “goods”.
Strong PO Controls System … Goods Come without PO … no Purchase entry in Finsys for “goods” ~ PV Passing Locked
Strong Quality Controls System … Goods Fail in QC … Automatic … no Purchase entry in Finsys for “goods” ~ PV Passing Locked
Strong Goods in Transit System …Automatic alert of pendency
17. Real-Time Dashboards for CXO-Level Decisions
Question: Can you see revenue, margins, inventory, receivables, and payables in real-time on your phone?
Reality Check: Tally is desktop-based. No mobile dashboards. Data is always 1-2 days old.
What You’re Losing:
Reactive decision-making (not proactive)
Inability to course-correct mid-month
Dependency on finance team for basic reports
18. Automated Exception Reporting
Question: Does your system alert you: “Plant B’s margin dropped 5% this week” or “Customer X’s payment is 15 days overdue”?
Reality Check: No automated alerts. You discover issues in monthly reviews (too late to act).
What You’re Losing:
Margin erosion (5% drop = ₹2.5 crore on ₹500 crore revenue)
Bad debt accumulation (₹1-2 crore annually)
Operational inefficiencies going unnoticed for weeks
19. Integration with Other Business Systems
Question: Is your accounting software integrated with CRM, e-commerce, manufacturing, and logistics systems?
Reality Check: Tally has limited APIs. Manual data entry from other systems. Data silos across departments. Finsys has all these things in its own relevant modules
What You’re Losing:
20-30 hours/week in manual data entry (₹15-20 lakh annually in labor costs)
Data errors from manual entry (2-5% error rate = ₹1-2 crore in corrections)
Inability to automate order-to-cash cycle
20. Scalability for Future Growth
Question: Can your current system handle: 12 plants, 8 GSTINs, 100+ users, Detailed Production and PPC and WIP ?
Reality Check: Tally struggles beyond 10-15 users. Performance degrades with large data.
What You’re Losing:
System crashes during critical periods (month-end, year-end)
Inability to acquire/merge new businesses (IT integration nightmare)
Technology debt (₹50 lakh-₹1 crore to migrate later)
💰 The Real Cost of Inaction
Area
Annual Loss
5-Year Impact
Suboptimal procurement (no consolidated buying)
₹10-15 crore
₹50-75 crore
Excess inventory (no multi-plant MRP)
₹5-10 crore
₹25-50 crore
Price arbitrage (different plants, different rates)
₹3-5 crore
₹15-25 crore
Inventory write-offs (no aging visibility)
₹2-4 crore
₹10-20 crore
Margin erosion (no real-time alerts)
₹2-3 crore
₹10-15 crore
Manual labor (data entry, consolidation)
₹50 lakh-₹1 crore
₹2.5-5 crore
TOTAL
₹22-38 crore
₹110-190 crore
You’re losing ₹22-38 crore EVERY YEAR by using accounting software designed for ₹10 crore businesses. ( Figures look exaggerated.. but could be really true for a large Rs 500 Crore company )
What Finsys ERP Delivers
Unified Multi-Location Architecture
Single supplier ledger across all plants and GSTINs
Consolidated P&L, Balance Sheet, and Cash Flow in one click
Automatic inter-company elimination for accurate group reporting
Advanced Multi-Plant MRP
Real-time stock visibility across all locations
Automated transfer recommendations (excess in Plant A → shortage in Plant B)
Purchase rate comparison across plants (identify price arbitrage)
Non-moving stock alerts before it becomes obsolete
Intelligent Financial Control
Multi-GSTIN compliance dashboard with automated filing
Deep understanding of Indian manufacturing and compliance
Proven track record with ₹100-1000 crore companies
End-to-end implementation support (not just software)
🔥 Final Thought
You didn’t build a ₹500 crore company by tolerating inefficiency.
So why are you running it on software designed for ₹10 crore businesses?
Every day you delay:
₹6-10 lakh in avoidable procurement costs
₹2-3 lakh in excess inventory carrying costs
₹1-2 lakh in margin erosion from delayed decisions
The question isn’t “Can we afford Finsys?”
The question is “Can we afford NOT to have Finsys?”
Ready to transform your multi-plant operations? Contact Finsys for a personalized ROI analysis.
Appendix: Detailed Technical Comparison
Tally vs. Finsys: Feature-by-Feature
Feature
Tally
Finsys ERP
Multi-company consolidation
Manual Excel
Automatic, real-time
Single supplier ledger across plants
❌ Not possible
✅ Native support
Multi-plant MRP
❌ Not available
✅ Advanced MRP with transfer optimization
Consolidated P&L
Manual
One-click
Consolidated Balance Sheet
Manual
One-click
Multi-GSTIN dashboard
❌ Separate tracking
✅ Unified compliance
Inter-plant stock transfer recommendations
❌ Manual
✅ Automated suggestions
Purchase rate comparison across plants
❌ Not possible
✅ Real-time analytics
Exception-based alerts
❌ Not available
✅ Proactive notifications
Mobile dashboards
❌ Desktop-only
✅ Web and mobile
API integrations
Limited
Extensive (CRM, e-commerce, logistics)
Scalability
10-15 users
100+ users, multi-currency
Implementation time
N/A
90 days for full deployment
This document is intended for business owners, CFOs, and decision-makers at manufacturing and trading companies with ₹100+ crore revenue operating multiple plants or locations.
Prepared by: Finsys ERP Product and Implementation Team
Last reviewed: 15th August 2026
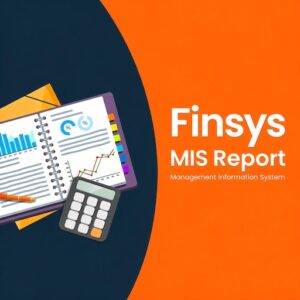
How Finsys and MLG Help You Stay in Control ~ MLG Finsys MIS Reports Package
A Practical MIS Review for Business Owners
Running an MSME is not only about increasing sales. It is also about knowing.…at the right time:
– How much money has been collected today. ?
– Which customers are overdue. ?
– What is lying in the bank. ?
– Which payments are pending ?.
– Which materials are moving slowly ?.
– Whether GST and TDS obligations are ready ?.
– Whether stock, sales, purchases, and cash are moving according to plan ?.
Many business owners receive information only at month-end. By then, a delayed collection, excess inventory, missed GST invoice, wrong purchase rate, or unapproved payment may already have affected profitability.
The purpose of this MIS review is simple:
> “To give the MD ready-to-use information so that important decisions do not depend only on assumptions,telephone calls, or delayed reports.”
Come,… Let us start
Finsys provides the system visibility. MLG Associates helps interpret the information, identify risks, and guide the management team.
Together, they help create a practical **MD Control Room** for your business.
***
What You Can Expect From This Review
This is not merely a software demonstration.
During the personal meeting, our team will help you understand:
1. What information the MD should receive daily, weekly, and monthly. 2. Which reports are already available in your Finsys system. 3. Which reports require better data entry or process discipline. 4. What business risks each report can reveal. 5. Which person in your organisation should act on the information. 6. How regular review can improve cash flow, working capital, compliance, stock control, and profitability.
The objective is not to create more reports.
The objective is to create better decisions with fewer surprises.
1. Daily MD Snapshot
Daily reports are designed to give the MD a quick view of the current position.
Sales Position
The MD can review:
– Sales for today.
– Sales for the current month up to date.
– Sales for the current financial year.
– Comparison with the corresponding period of the previous year.
– Sales by customer, salesperson, product, branch, or location, wherever applicable.
Why it matters
A sales figure by itself is not enough. Management should also know whether sales are growing, whether the growth is profitable, and whether collections are keeping pace with sales.
Questions for the MD
– Are we achieving our daily and monthly sales plan?
– Which products or customers are contributing to the growth?
– Is sales growth coming with healthy margins?
– Are sales increasing while collections are slowing down?
Collection Position
The collection report may show:
– Collections received today.
– Collections received during the month.
– Collections during the financial year.
– Comparison with the previous year.
– Customer-wise collections.
– Salesperson-wise or territory-wise collection performance.
Why it matters
Profit shown in the Profit & Loss Account does not automatically mean cash has been received.
A business may show strong sales and profit but still face pressure because receivables are not collected on time.
**Questions for the MD**
– Which major customers have not paid as expected?
– Are salespeople following up for collections?
– Are customer advances properly adjusted?
– Are deductions and short payments being identified quickly?
***
Bank Ledger and Bank Position
The MD should receive a clear view of:
– Bank balances.
– Receipts and payments.
– Cheques issued but not presented.
– Cheques deposited but not cleared.
– Bank-wise position.
– Available drawing power or working capital position, where applicable.
Why it matters
A bank balance is not always the same as immediately available cash.
The business may have:
– Cheques issued but not yet presented.
– Customer cheques under clearing.
– Bank charges not recorded.
– Receipts credited in the bank but not adjusted in the books.
– Temporary funds available in one bank but shortages in another.
***
Bank Reconciliation
Bank reconciliation should help identify:
– Deposits recorded in the books but not yet credited by the bank.
– Payments recorded in the books but not yet presented.
– Bank charges and interest not entered in the books.
– Direct credits or debits appearing in the bank statement.
– Unidentified transactions.
– Old uncleared items requiring follow-up.
Why it matters
Regular reconciliation reduces the risk of:
– Duplicate payments.
– Missing receipts.
– Incorrect bank balances.
– Delayed detection of unauthorised transactions.
– Incorrect cash-flow decisions.
***
Suspense Accounts
The team should review suspense receipts and suspense payments regularly.
**The review should ask:**
– Why has the amount not been identified?
– Which customer, supplier, employee, or bank account is involved?
– Who is responsible for resolving it?
– How long has the amount remained pending?
– Is there a possibility of duplicate payment or incorrect accounting?
**MD benefit**
Suspense accounts are not merely an accounting issue. They may hide:
– Payments approved but not released.
– Payments awaiting approval.
– Supplier bills received but not processed.
– Bills pending because of missing purchase orders, goods receipt, quality approval, or supporting documents.
Why it matters
This helps management balance two priorities:
– Paying suppliers on time.
– Avoiding premature or duplicate payments.
Instead of asking different departments for separate updates, the MD receives one structured daily snapshot.
***
2. Weekly “Working-Capital” Review : Debtors and creditors
Weekly reports help management control money blocked in customers, suppliers, stock, advances, and pending transactions.
Customer Outstanding: 30–60–90–120–150–180 Days
The report should be reviewed:
– Customer-wise.
– Salesperson-wise.
– Branch-wise.
– Ageing-wise.
– Against approved credit limits.
– Against agreed payment terms.
**Questions for the MD**
– Which customer accounts are moving beyond agreed credit terms?
– Which salesperson has the largest overdue collection?
– Are any customers continuously purchasing without clearing old dues?
– Is the business giving credit to customers who are already overdue?
***
Bills With Short Payment
This report identifies invoices where the customer has paid less than the billed amount.
A small deduction on hundreds of invoices can become a significant annual loss.
The objective is not always to recover every deduction. It is to identify recurring patterns and prevent avoidable leakage.
***
Customer Advances
Customer advances require regular review because:
– The invoice may not yet have been raised.
– GST treatment may require attention.
– The advance may relate to an old order.
– The order may have been cancelled.
– The amount may have been received against the wrong customer ledger.
**MD benefit**
This report helps the business convert advances into sales correctly and avoid old balances remaining unexplained.
***
Customer Dues Older Than 180 Days
Old receivables require special attention.
The review should classify them as:
– Recoverable.
– Under dispute.
– Subject to documentation issues.
– Financially stressed customer.
– Likely doubtful.
– Requiring legal or commercial action.
**Important caution**
The accounting and tax treatment of old receivables should be reviewed with the company’s tax and audit advisors based on the applicable facts. The report is a management-warning tool; it is not a substitute for a specific legal or tax opinion.
***
3. Supplier and MSME Payment Review
Supplier Outstanding: 30–60–90–120–150–180 Days
The MD should see supplier dues:
– Supplier-wise.
– Purchase-category-wise.
– Location-wise.
– Ageing-wise.
– Against agreed payment terms.
– Separately for disputed and undisputed balances.
– Advance paid but material not received.
– Material received but invoice not received.
– Invoice received but not adjusted against advance.
– TDS or GST documentation pending.
– Old advances requiring recovery or adjustment.
The purpose of this review is to separate genuine payable amounts from balances that require correction or settlement.
***
Supplier Dues Beyond Applicable MSME Payment Timelines
Management should identify dues that may require attention under applicable MSME payment and tax provisions.
This report should be reviewed jointly by:
– The MD.
– Purchase department.
– Accounts department.
– Finance team.
– Tax or compliance advisor.
**Why it matters**
The report helps management take action before the issue becomes:
– A supplier dispute.
– A compliance concern.
– A tax-adjustment issue.
– A cash-flow problem.
– A year-end disclosure or audit concern.
***
4. Unadjusted Receipts and Payments
Suspense Receipts and Suspense Payments
The objective is to ensure that every receipt and payment reaches the correct ledger.
**Review points**
– Is the customer or supplier identified?
– Is the amount related to an invoice?
– Is a bank narration available?
– Is there any possibility of duplicate payment?
– Has the responsible employee been assigned?
– Is the item older than the permitted resolution period?
***
On-Account Receipts
On-account receipts should be reviewed to identify:
– Customer deductions.
– Unadjusted advances.
– Invoice-wise payment allocation.
– TDS deductions.
– Short payments.
– Receipts credited to the wrong customer.
**MD benefit**
Early identification allows the company to recover genuine deductions and adjust books properly.
This provides better control over working capital and reduces the risk of funds remaining unadjusted.
***
5. GST and Documentation Control
GST Invoices Not Recorded in the Books
This review can identify invoices that may have been received operationally but are not yet recorded in accounts.
Possible reasons:
– Invoice pending from purchase department.
– Goods received but bill not received.
– Bill pending quality approval.
– Bill pending accounts entry.
– Invoice received at another location.
– Vendor has issued an incorrect invoice.
***
GST Invoices Not Appearing on the GST Portal
The team may follow up on invoices that are:
– Recorded in the books but not reflected on the portal.
– Reflected with an incorrect GSTIN.
– Reflected with an incorrect invoice number.
– Reflected with an incorrect taxable value or tax amount.
– Pending due to vendor filing or amendment.
**Why it matters**
This helps the company monitor input-tax-credit risks and follow up with suppliers in time.
The final tax treatment should always be confirmed with the responsible tax professional based on the relevant GST provisions and records.
***
Pending GST E-Invoices
The report should identify invoices requiring attention before dispatch or reporting, wherever e-invoicing provisions apply.
**Questions for management**
– Which invoices are pending?
– Is the delay due to master-data problems?
– Is the customer GSTIN valid?
– Is the HSN or tax rate correct?
– Is the invoice blocked because of a system or process issue?
– Has material already been dispatched?
***
6. Monthly Financial Review
Profit and Loss Account With Ratio Analysis
The MD should receive more than a simple P&L.
The monthly review may include:
– Sales growth.
– Gross profit percentage.
– EBITDA.
– Net profit.
– Expense ratios.
– Contribution by product.
– Contribution by customer.
– Plant or branch profitability.
– Comparison with budget and previous year.
**Questions for the MD**
– Is profit improving because of genuine efficiency or temporary factors?
– Which expenses are increasing faster than sales?
– Which product or customer has reduced margins?
– Are freight, power, salary, finance cost, or rejection costs rising?
***
Bank Stock and Debtors Statement
Where applicable, the report may support preparation and review of bank stock and debtor statements.
The team should reconcile:
– Stock as per books.
– Stock as per physical or operational records.
– Debtors as per books.
– Eligible receivables.
– Credit notes and old receivables.
– Drawing-power calculations.
**MD benefit**
This reduces the chance of differences between internal records and information submitted to financial institutions.
***
Cash Flow or Funds Flow Report
The report should help the MD understand:
– Opening cash and bank balance.
– Expected collections.
– Expected payments.
– GST and TDS outflows.
– Salaries and statutory payments.
– Loan instalments and interest.
– Purchase commitments.
– Planned capital expenditure.
– Surplus or shortage of funds.
**The key question**
> Will the business have sufficient cash when the payment actually falls due?
Profitability and cash flow must be reviewed together.
The dates shown in internal MIS should be treated as management targets and verified against the applicable statutory due dates for the relevant taxpayer and period.
***
Customer Credit Limit Versus Outstanding
This report compares:
– Approved credit limit.
– Current outstanding.
– Overdue amount.
– Pending sales orders.
– Customer advances.
– Security or collateral, where applicable.
– Proposed further sales.
**MD benefit**
The MD can make a conscious decision before allowing additional credit to a customer.
***
Early Payments to Suppliers
The report identifies purchases paid before the agreed due date.
Management can then ask:
– Was an early-payment discount received?
– Was early payment necessary?
– Was the payment made due to pressure from the supplier?
– Could the funds have been used elsewhere?
– Is the payment policy being followed?
***
Late Collection From Customers
This report compares customer collection with agreed payment terms.
These accounts should be reviewed periodically for:
– Old advances.
– Missing supporting documents.
– Unadjusted travel expenses.
– Personal or non-business payments.
– Repeated advances to the same person.
– Unused balances.
**MD benefit**
Small unadjusted balances can become large control weaknesses when repeated across the organisation.
***
Directors and Related-Party Ledger Accounts
These accounts should be reviewed for:
– Debit or credit balances.
– Unadjusted personal expenses.
– Advances.
– Business expenses paid personally.
– Transactions requiring approval or disclosure.
– Balances remaining outstanding for long periods.
The review should be performed with appropriate confidentiality and in consultation with the company’s auditor or tax advisor wherever required.
***
Bank Interest and Finance Cost Review
The team can compare:
– Sanctioned interest rate.
– Applicable rate.
– Actual interest charged.
– Penal interest.
– Processing charges.
– Commitment charges.
– Other bank charges.
– Excess charges or unexplained differences.
**MD benefit**
A small difference in interest rate or bank charges can have a significant impact on a large working-capital limit.
***
7. Production and Operations Review
Slow-Moving Finished Goods
The report should identify finished goods remaining beyond the company’s normal holding period.
**Questions for management**
– Is there confirmed demand?
– Is the product still saleable?
– Is the stock packed according to current customer requirements?
– Is the selling price adequate?
– Should a special sales plan or transfer be considered?
***
Slow-Moving Raw Materials
Raw materials beyond the defined holding period should be classified as:
– Required for confirmed orders.
– Required for regular production.
– Surplus.
– Obsolete or near-obsolete.
– Transferable to another plant or product line.
– Requiring purchase-plan revision.
**MD benefit**
The aim is to release blocked working capital before it becomes a write-off.
***
Purchased Material With Rejections
The report should track:
– Supplier name.
– Purchase order.
– Material received.
– Quantity rejected.
– Reason for rejection.
– Replacement status.
– Debit note or claim status.
– Production impact.
– Financial impact.
***
Customer Returns
Returned material should be reviewed for:
– Customer.
– Invoice.
– Quantity.
– Reason for return.
– Quality issue.
– Transport damage.
– Commercial dispute.
– Replacement or credit-note action.
– Re-entry into saleable stock.
***
Material Received in Late Hours
This report can help identify receipts occurring outside normal operating hours.
Management may review:
– Whether the purchase was approved.
– Whether the receipt was genuinely urgent.
– Whether the quality check was completed.
– Whether the entry date is correct.
– Whether there is any risk of backdated or delayed documentation.
***
Material Shipped in Late Hours
The MD may review late-hour dispatches for:
– Customer urgency.
– Transport planning.
– Sales order reference.
– Invoice and e-way documentation.
– Dispatch approval.
– Freight impact.
– Repeated exceptions by location or customer.
***
Pending Sales Orders
The report should show:
– Customer.
– Order date.
– Product.
– Quantity.
– Promised delivery date.
– Available stock.
– Production status.
– Dispatch status.
– Reason for delay.
**MD benefit**
This enables management to protect customer relationships and prioritise production intelligently.
– Supplier.
– Order value.
– Order date.
– Expected delivery date.
– Material pending.
– Advance paid.
– Production impact.
– Revised expected date.
***
8. Stock-Related MIS
Raw-Material Closing Stock
The raw-material stock report may be valued using the company’s approved method, such as actual landed cost or FIFO, subject to the company’s accounting policy and applicable reporting requirements.
Where applicable, other stock categories should be reported separately with clear definitions and valuation logic.
**Important principle**
Every stock report should clearly state:
– Quantity basis.
– Valuation basis.
– Date of report.
– Location.
– Whether the figure is book stock, physical stock, or operational stock.
– Whether rejected or blocked stock is included.
– Item.
– Quantity.
– Value.
– Date of rejection.
– Reason.
– Responsible party.
– Expected action.
– Disposal, replacement, return, or rework status.
***
Pending Quality-Control Stock
The report should identify material remaining in quality control beyond the defined number of days.
**Questions for the MD**
– Why is the material not released?
– Is the delay due to laboratory testing, documentation, manpower, or quality dispute?
– Is production waiting for the material?
– Is the material included incorrectly in available stock?
– Is supplier or customer communication required?
***
How the Personal Meeting Will Work
Step 1: Understand the MD’s Priorities
The Finsys and MLG team will first understand the MD’s key concerns, such as:
We will not overwhelm the MD with every available report.
We will select the reports most relevant to the business and demonstrate how each one answers a practical management question.
For example:
> “Which customers are using our working capital beyond the approved credit period?”
or:
> “Do we have excess raw material in one location while another location is purchasing the same item?”
***
Step 3: Explain the Business Meaning
A report is valuable only when management understands what action it requires.
For each report, the team will explain:
– What the report shows.
– Why it matters.
– What warning signs to look for.
– Who should act.
– How quickly the matter should be resolved.
– What information must be improved for better reporting.
The implementation can begin with a small number of high-value reports, such as:
1. Sales and collection position.
2. Bank position and reconciliation.
3. Customer ageing.
4. Supplier ageing.
5. Cash-flow forecast.
6. Slow-moving stock.
7. Pending purchase and sales orders.
8. GST invoice reconciliation.
9. Profitability and ratio analysis.
10. Suspense and on-account balances.
Once the MD sees the value, additional reports can be added systematically.
***
What the Client Team Must Do
Finsys and MLG can guide, configure, review, and follow up. However, accurate MIS depends on timely and correct data entry.
The client team remains responsible for:
– Entering transactions correctly.
– Creating accurate customer, supplier, item, and GST masters.
– Recording receipts and payments promptly.
– Completing purchase and sales documentation.
– Recording material receipts and dispatches.
– Completing quality and stock confirmations.
– Sharing bank statements and supporting documents.
– Assigning responsible persons for pending items.
– Providing explanations for exceptions.
> **Correct data in the system creates reliable management information.**
***
What Finsys Will Contribute
Finsys helps provide the technology platform for:
– Integrated accounting.
– Sales and purchase workflows.
– Inventory and stock visibility.
– Order tracking.
– Bank and receivable information.
– Multi-location reporting, where configured.
– Automated MIS generation.
– User-wise process discipline.
– Dashboards and management reports.
The exact reports and automation available will depend on the client’s Finsys modules, configuration, transaction discipline, and agreed scope.
***
What MLG Associates Will Contribute
MLG Associates can help the client with:
– MIS interpretation.
– Accounting and control review.
– GST and TDS follow-up.
– Receivable and payable ageing review.
– Working-capital guidance.
– Ratio and profitability analysis.
– Suspense and ledger scrutiny.
– Monthly management discussions.
– Identification of reporting gaps.
– Guidance for corrective action.
The objective is not merely to point out mistakes.
The objective is to help management understand the issue, decide the action, and monitor closure.
***
The MD’s Expected Outcome
After adopting this approach, the MD should gradually gain better visibility over:
– Daily sales.
– Daily collections.
– Cash and bank position.
– Customer and supplier exposure.
– Pending approvals.
– Stock ageing.
– Production and dispatch commitments.
– GST and TDS readiness.
– Profitability and expenses.
– Cash-flow requirements.
– Operational exceptions.
The desired outcome is:
> **Less dependence on informal updates. More control through timely, organised information.**
***
A Simple Monthly MD Meeting Agenda
1. Business Performance
– Sales versus target.
– Sales versus previous year.
– Collection versus sales.
– Gross profit and EBITDA.
– Key product and customer performance.
***
2. Cash and Working Capital
– Bank position.
– Expected collections.
– Payments due.
– Customer ageing.
– Supplier ageing.
– Advances and on-account balances.
– GST status.
– TDS status.
– Unrecorded or unmatched invoices.
– Suspense accounts.
– Bank reconciliation.
– Related-party and director balances.
***
5. Action Plan
– Issue.
– Responsible person.
– Required action.
– Due date.
– Status at the next meeting.
***
Questions the MD Should Ask Every Month
1. What is our current cash position?
2. How much collection is expected in the next 15 and 30 days?
3. Which customers are overdue beyond agreed terms?
4. Which suppliers are awaiting payment?
5. Are any MSME-related payment matters pending review?
6. What stock is moving slowly?
7. Can any excess material be used or transferred elsewhere?
8. Which purchase orders are pending receipt?
9. Which sales orders are delayed?
10. Are any customer or vendor advances old and unadjusted?
11. Are there any invoices in the books but not reflected on the GST portal?
12. Are there any GST e-invoices pending?
13. Which expenses have increased unusually?
14. Is the bank charging the agreed interest and fees?
15. Which suspense accounts are still unresolved?
16. Are any director or related-party balances outstanding?
17. What is our expected tax and statutory cash requirement?
18. Which product, customer, branch, or plant has reduced profitability?
19. Which issue requires immediate MD intervention?
20. What are the five actions to be closed before the next review?
The challenge is that important information is often:
– Spread across departments.
– Available only in separate files.
– Delayed until month-end.
– Not compared with targets.
– Not assigned to a responsible person.
– Not converted into an action plan.
A structured MIS review helps the MD move from:
> “Please find out what happened.”
to:
> “I know what is happening, why it is happening, and what action is required.”
***
Finsys + MLG: A Practical Partnership for Better Control
> **We do not want to give you more paperwork. We want to give you more control.**
***
Begin With Your Top Five Questions
Before the meeting, the MD may identify the five questions that matter most today.
For example:
– Where is my money blocked?
– Which customer is delaying payment?
– Which stock is becoming slow-moving?
– Which purchase is costing more than necessary?
– What compliance or banking issue needs immediate attention?
The Finsys and MLG team will then demonstrate how the relevant information can be organised, reviewed, and followed up.
***
Schedule Your Management Information Review
If your business has grown beyond informal registers, scattered spreadsheets, and delayed monthly information, it may be time to create a structured MD reporting system.
A personal review with the Finsys and MLG team can help you:
– Understand the current information flow.
– Identify important reporting gaps.
– Select the most relevant MIS reports.
– Define daily, weekly, and monthly reviews.
– Improve accountability across departments.
– Build a practical management-control routine.
The objective is simple:
> **To help the MD remain informed, confident, and in control—without having to personally chase every department for every answer.**
Finsys
Integrated ERP and business-process visibility for growing organisations.
MLG Associates
Accounting, tax, compliance, MIS review, and business guidance for management.
**To arrange a personal MIS review, speak with the Finsys and MLG team.**
***
*Note: Report names, frequency, calculations, and statutory review dates should be customised to the client’s business, ERP configuration, transaction discipline, applicable law, and professional advice. The client team is responsible for timely and accurate data entry in non-accounts modules.*
***
so that your Mission is Accomplished
A nicely Curated Bouquet… of some of the MIS Reports.. that the Finsys brings to you Daily.. Weekly.. and Monthly… .. Yes, this works.
Finsys is better than Tally / Busy in case of Multi Factory setup . Know How ?
20 Critical Accounting & Operational Checkpoints Every ₹100 – ₹500 Crore Company Owner Must Review
Why This Matters to You
If you’re running a ₹100 crore to ₹500 crore manufacturing or trading business with multiple plants, factories, or locations across India, you’re likely losing crores annually without even knowing it. Your current accounting software (Tally or Busy, or similar) was designed for small businesses—not for complex, multi-location enterprises like yours.
This checklist exposes 20 critical blind spots that keep you from having real-time visibility, consolidated control, and data-driven decision-making across your entire organization.
🚨 The Hard Truth
Tally and similar accounting software have fundamental limitations that become critical bottlenecks at your scale:
❌ Cannot create one “supplier ledger” across all plants (each location maintains separate ledgers)
❌ Bank reconciliation across multiple locations is manual and fragmented
❌ Consolidated Balance Sheet cannot be generated automatically across entities
❌ Joint GST payable across all GSTINs? Not possible without manual consolidation
❌ No multi-plant MRP—you’re overstocking in Plant A while Plant B faces shortages
❌ No inter-plant stock optimization—excess inventory sits idle while other plants purchase fresh
❌ Weak Gate Entry System … Goods may not Cross “Gate” … yet accounts may pass the Purchase entry in Tally Traditional version. ( Finsys has strong GATE entry system with QR codes)
❌ Weak PO Controls System … Since there is no Gate Module…. Goods Come without PO … PV Passing is not Locked
❌ Weak / No Quality Controls System … Goods Fail in QC … yet Purchase entry is not Locked
❌ No Goods in Transit System … Goods go from plant 1 to plant 2… in tally, Plant 2 does not know about any goods in transit
Strong Gate Entry System … Goods do not Cross Gate … no Purchase entry in Finsys for “goods”.
❌ Strong PO Controls System … Goods Come without PO … no Purchase entry in Finsys for “goods” ~ PV Passing Locked
❌ Strong Quality Controls System … Goods Fail in QC … Automatic … no Purchase entry in Finsys for “goods” ~ PV Passing Locked
❌ Accounts does not know the Job Card position
❌ Production done even for black listed customer… ( in case of non payment .. ) .. here Job card level control is possible
Result: You’re making ₹500 crore decisions with fragmented, delayed, and incomplete data. & Some Forced Errors also
✅ The 20-Point Checklist: Questions Every Owner Must Ask
Section 3: Financial Control & Compliance (Points 13-16)
13. Automated Financial Consolidation for Board Reporting
Question: Can you generate board-ready consolidated financials in 1 day (not 7-10 days)?
Reality Check: Manual Excel consolidation. Inter-company eliminations done manually. Version control issues.
What You’re Losing:
Delayed strategic decisions (by the time you see numbers, situation has changed)
Board frustration (investors expect T+3 day reporting)
Finance team burnout (month-end closes take 10-12 days)
14. Multi-GSTIN Data and Dashboard
Question: Can your make GST returns for all plants in 1 go… automatically… even if you have 3 plants in same state ( Example Nashik, Pune and Thane… all in Maharashtra )… or ( Gurgaon, Manesar and Sonepat, all in Haryana ) ?
Reality Check: Each “tally company” Data is taken separately.
15. Automated Cost Center-wise Profitability
Question: Can you see profitability by product line, customer, region, AND plant simultaneously?
Reality Check: Tally’s cost centers are limited. Multi-dimensional profitability analysis requires manual Excel work. .. Finsys can make BOM BASED and even time based cost sheets for each product you manufacture.
What You’re Losing:
Inability to kill unprofitable products/customers (₹5-10 crore in hidden losses)
Misallocation of resources to low-margin segments
No data-driven pricing decisions
16. Cash Flow Forecasting Across All Entities
Question: Can you see consolidated cash position and 90-day cash flow forecast for the entire group?
Reality Check: Each location maintains separate cash flow. No automated consolidation. Forecasts are Excel-based and outdated.
What You’re Losing:
Emergency borrowing at high interest (₹2-3 crore annually in extra interest)
Missed investment opportunities (cash sitting idle in one entity while another borrows)
Inability to negotiate better banking terms (no consolidated cash visibility)
Finsys has Strong Gate Entry System … Goods do not Cross Gate … no Purchase entry in Finsys for “goods”.
Strong PO Controls System … Goods Come without PO … no Purchase entry in Finsys for “goods” ~ PV Passing Locked
Strong Quality Controls System … Goods Fail in QC … Automatic … no Purchase entry in Finsys for “goods” ~ PV Passing Locked
Strong Goods in Transit System …Automatic alert of pendency
17. Real-Time Dashboards for CXO-Level Decisions
Question: Can you see revenue, margins, inventory, receivables, and payables in real-time on your phone?
Reality Check: Tally is desktop-based. No mobile dashboards. Data is always 1-2 days old.
What You’re Losing:
Reactive decision-making (not proactive)
Inability to course-correct mid-month
Dependency on finance team for basic reports
18. Automated Exception Reporting
Question: Does your system alert you: “Plant B’s margin dropped 5% this week” or “Customer X’s payment is 15 days overdue”?
Reality Check: No automated alerts. You discover issues in monthly reviews (too late to act).
What You’re Losing:
Margin erosion (5% drop = ₹2.5 crore on ₹500 crore revenue)
Bad debt accumulation (₹1-2 crore annually)
Operational inefficiencies going unnoticed for weeks
19. Integration with Other Business Systems
Question: Is your accounting software integrated with CRM, e-commerce, manufacturing, and logistics systems?
Reality Check: Tally has limited APIs. Manual data entry from other systems. Data silos across departments. Finsys has all these things in its own relevant modules
What You’re Losing:
20-30 hours/week in manual data entry (₹15-20 lakh annually in labor costs)
Data errors from manual entry (2-5% error rate = ₹1-2 crore in corrections)
Inability to automate order-to-cash cycle
20. Scalability for Future Growth
Question: Can your current system handle: 12 plants, 8 GSTINs, 100+ users, Detailed Production and PPC and WIP ?
Reality Check: Tally struggles beyond 10-15 users. Performance degrades with large data.
What You’re Losing:
System crashes during critical periods (month-end, year-end)
Inability to acquire/merge new businesses (IT integration nightmare)
Technology debt (₹50 lakh-₹1 crore to migrate later)
💰 The Real Cost of Inaction
Area
Annual Loss
5-Year Impact
Suboptimal procurement (no consolidated buying)
₹10-15 crore
₹50-75 crore
Excess inventory (no multi-plant MRP)
₹5-10 crore
₹25-50 crore
Price arbitrage (different plants, different rates)
₹3-5 crore
₹15-25 crore
Inventory write-offs (no aging visibility)
₹2-4 crore
₹10-20 crore
Margin erosion (no real-time alerts)
₹2-3 crore
₹10-15 crore
Manual labor (data entry, consolidation)
₹50 lakh-₹1 crore
₹2.5-5 crore
TOTAL
₹22-38 crore
₹110-190 crore
You’re losing ₹22-38 crore EVERY YEAR by using accounting software designed for ₹10 crore businesses. ( Figures look exaggerated.. but could be really true for a large Rs 500 Crore company )
What Finsys ERP Delivers
Unified Multi-Location Architecture
Single supplier ledger across all plants and GSTINs
Consolidated P&L, Balance Sheet, and Cash Flow in one click
Automatic inter-company elimination for accurate group reporting
Advanced Multi-Plant MRP
Real-time stock visibility across all locations
Automated transfer recommendations (excess in Plant A → shortage in Plant B)
Purchase rate comparison across plants (identify price arbitrage)
Non-moving stock alerts before it becomes obsolete
Intelligent Financial Control
Multi-GSTIN compliance dashboard with automated filing
Deep understanding of Indian manufacturing and compliance
Proven track record with ₹100-1000 crore companies
End-to-end implementation support (not just software)
🔥 Final Thought
You didn’t build a ₹500 crore company by tolerating inefficiency.
So why are you running it on software designed for ₹10 crore businesses?
Every day you delay:
₹6-10 lakh in avoidable procurement costs
₹2-3 lakh in excess inventory carrying costs
₹1-2 lakh in margin erosion from delayed decisions
The question isn’t “Can we afford Finsys?”
The question is “Can we afford NOT to have Finsys?”
Ready to transform your multi-plant operations? Contact Finsys for a personalized ROI analysis.
Appendix: Detailed Technical Comparison
Tally vs. Finsys: Feature-by-Feature
Feature
Tally
Finsys ERP
Multi-company consolidation
Manual Excel
Automatic, real-time
Single supplier ledger across plants
❌ Not possible
✅ Native support
Multi-plant MRP
❌ Not available
✅ Advanced MRP with transfer optimization
Consolidated P&L
Manual
One-click
Consolidated Balance Sheet
Manual
One-click
Multi-GSTIN dashboard
❌ Separate tracking
✅ Unified compliance
Inter-plant stock transfer recommendations
❌ Manual
✅ Automated suggestions
Purchase rate comparison across plants
❌ Not possible
✅ Real-time analytics
Exception-based alerts
❌ Not available
✅ Proactive notifications
Mobile dashboards
❌ Desktop-only
✅ Web and mobile
API integrations
Limited
Extensive (CRM, e-commerce, logistics)
Scalability
10-15 users
100+ users, multi-currency
Implementation time
N/A
90 days for full deployment
This document is intended for business owners, CFOs, and decision-makers at manufacturing and trading companies with ₹100+ crore revenue operating multiple plants or locations.
Prepared by: Finsys ERP Product and Implementation Team
Last reviewed: 15th August 2026
ERP Software for Corrugation Packaging, Plastic Moulding, Auto Components, Software for Industry, Made in India.,